Open Access
Fig. 8.
Download original image
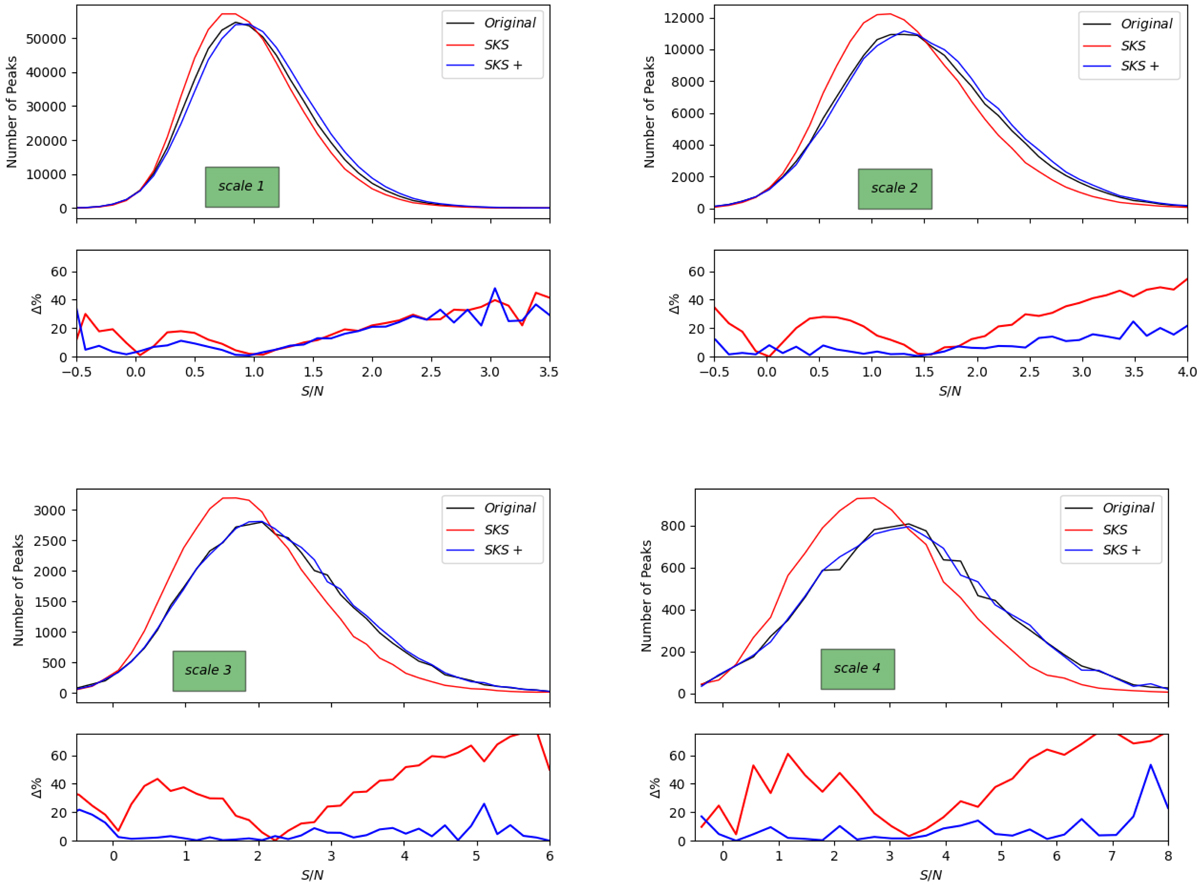
Peak counts: Convergence map (black) to the Peaks estimated on the SKS (red) and SKS+ (blue) convergence maps over the wavelet coefficient maps {wj} up to jmax = 4. The plots show the average peaks of the 10 simulated maps for angular resolution Nside = 2048 and estimations are only made outside the mask M.
Current usage metrics show cumulative count of Article Views (full-text article views including HTML views, PDF and ePub downloads, according to the available data) and Abstracts Views on Vision4Press platform.
Data correspond to usage on the plateform after 2015. The current usage metrics is available 48-96 hours after online publication and is updated daily on week days.
Initial download of the metrics may take a while.