Fig. 2
Download original image
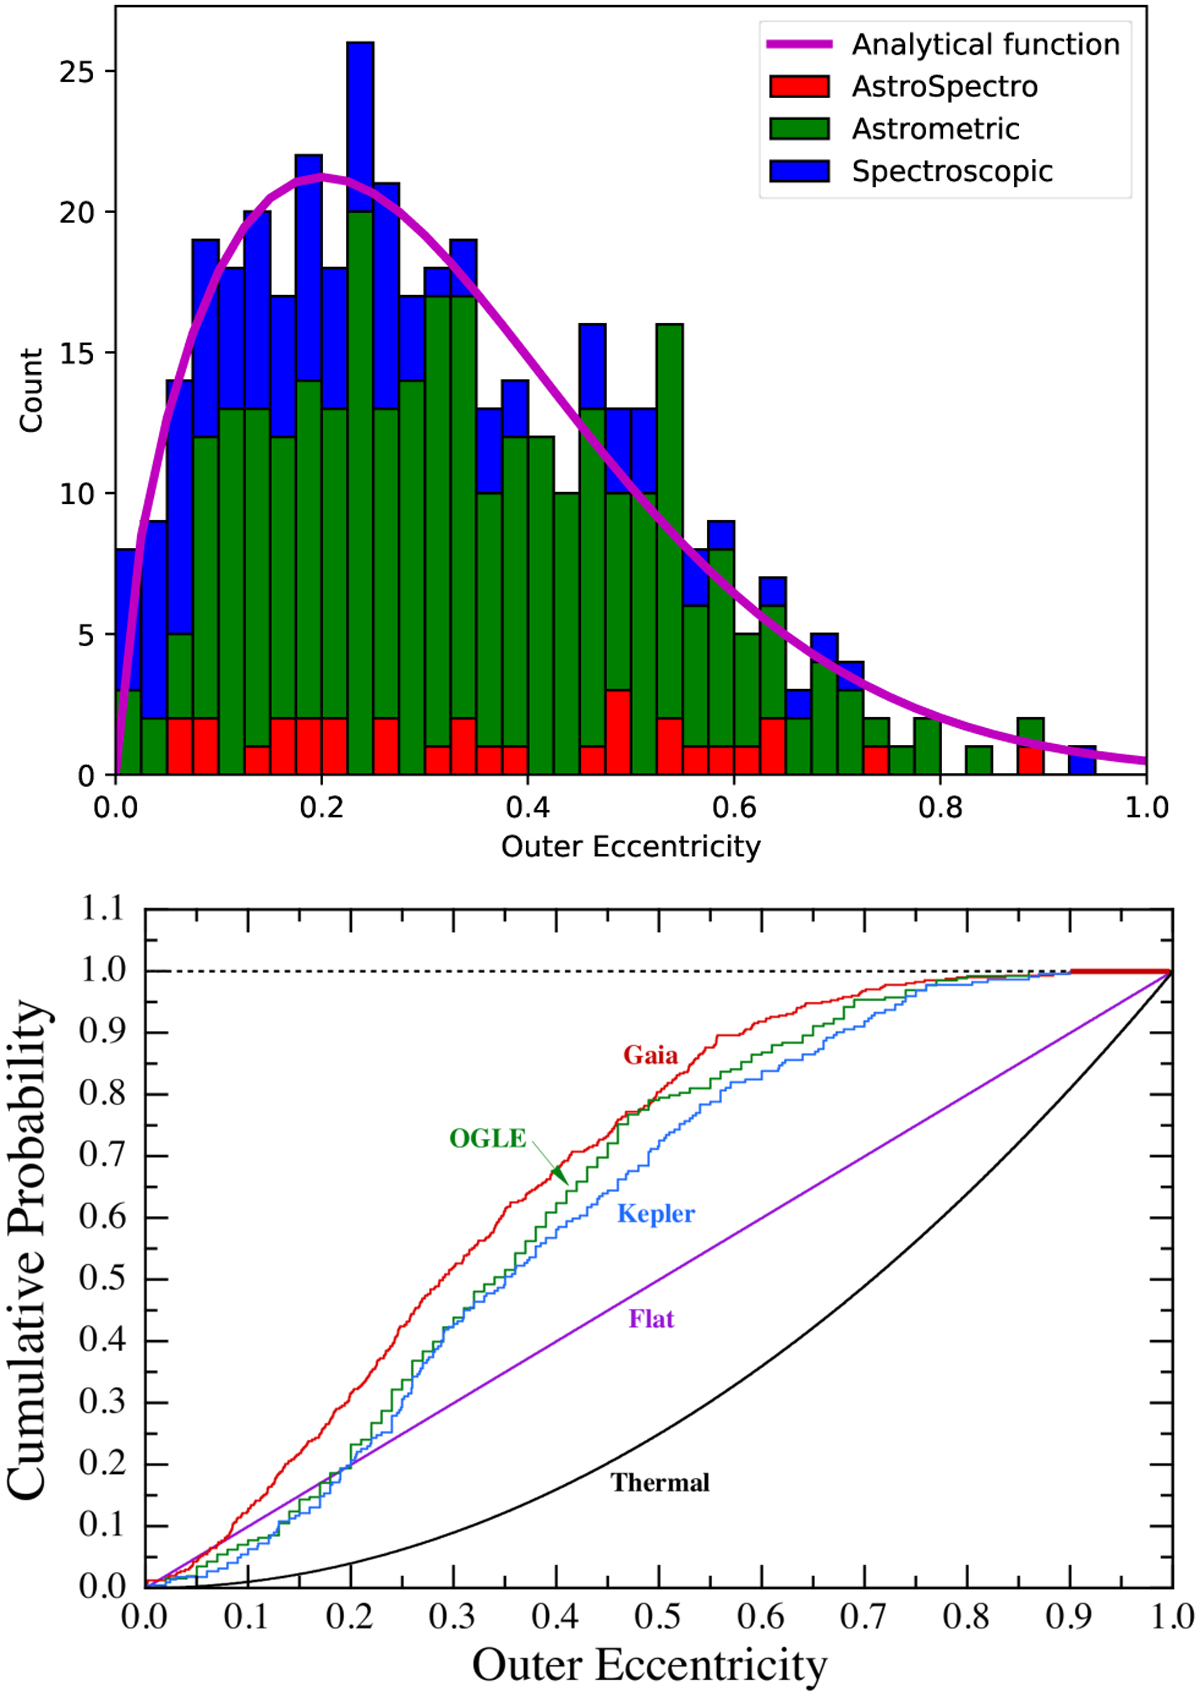
Distributions of outer orbital eccentricities. Top panel: differential probability distribution of the outer orbit eccentricities for our newly identified hierarchical triple star candidates. Different colors represent different types of Gaia NSS orbital solutions. The magenta line shows the analytical function described in Eq. (1). Bottom panel: cumulative eccentricity distributions. Green – OGLE; blue – Kepler; red – Gaia (this study); purple – dN/de = constant; black – a so-called thermal distribution with dN/de ∝ e.
Current usage metrics show cumulative count of Article Views (full-text article views including HTML views, PDF and ePub downloads, according to the available data) and Abstracts Views on Vision4Press platform.
Data correspond to usage on the plateform after 2015. The current usage metrics is available 48-96 hours after online publication and is updated daily on week days.
Initial download of the metrics may take a while.