Fig. 3
Download original image
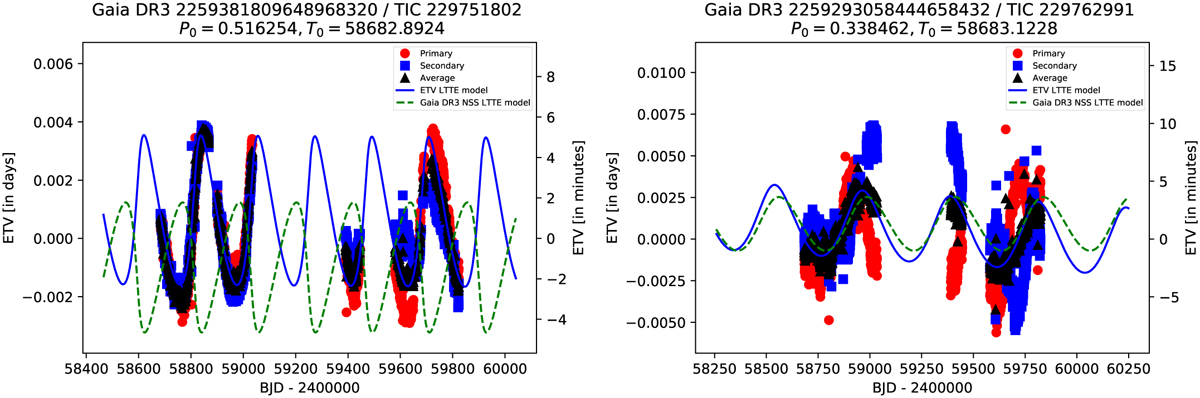
TESS ETVs and their corresponding LTTE models for two of our validated triple candidates. Delay times calculated from primary and secondary eclipses are indicated with red and blue points, respectively, while their averaged values for the same orbital cycles are shown with black points. The green dashed lines denote the LTTE models calculated with the orbital parameters from the Gaia NSS solution, while the blue lines represent our LTTE models after modifications in the orbital parameters. P0 and T0 are the eclipsing period and the epoch values, respectively, used to calculate the ETVs.
Current usage metrics show cumulative count of Article Views (full-text article views including HTML views, PDF and ePub downloads, according to the available data) and Abstracts Views on Vision4Press platform.
Data correspond to usage on the plateform after 2015. The current usage metrics is available 48-96 hours after online publication and is updated daily on week days.
Initial download of the metrics may take a while.