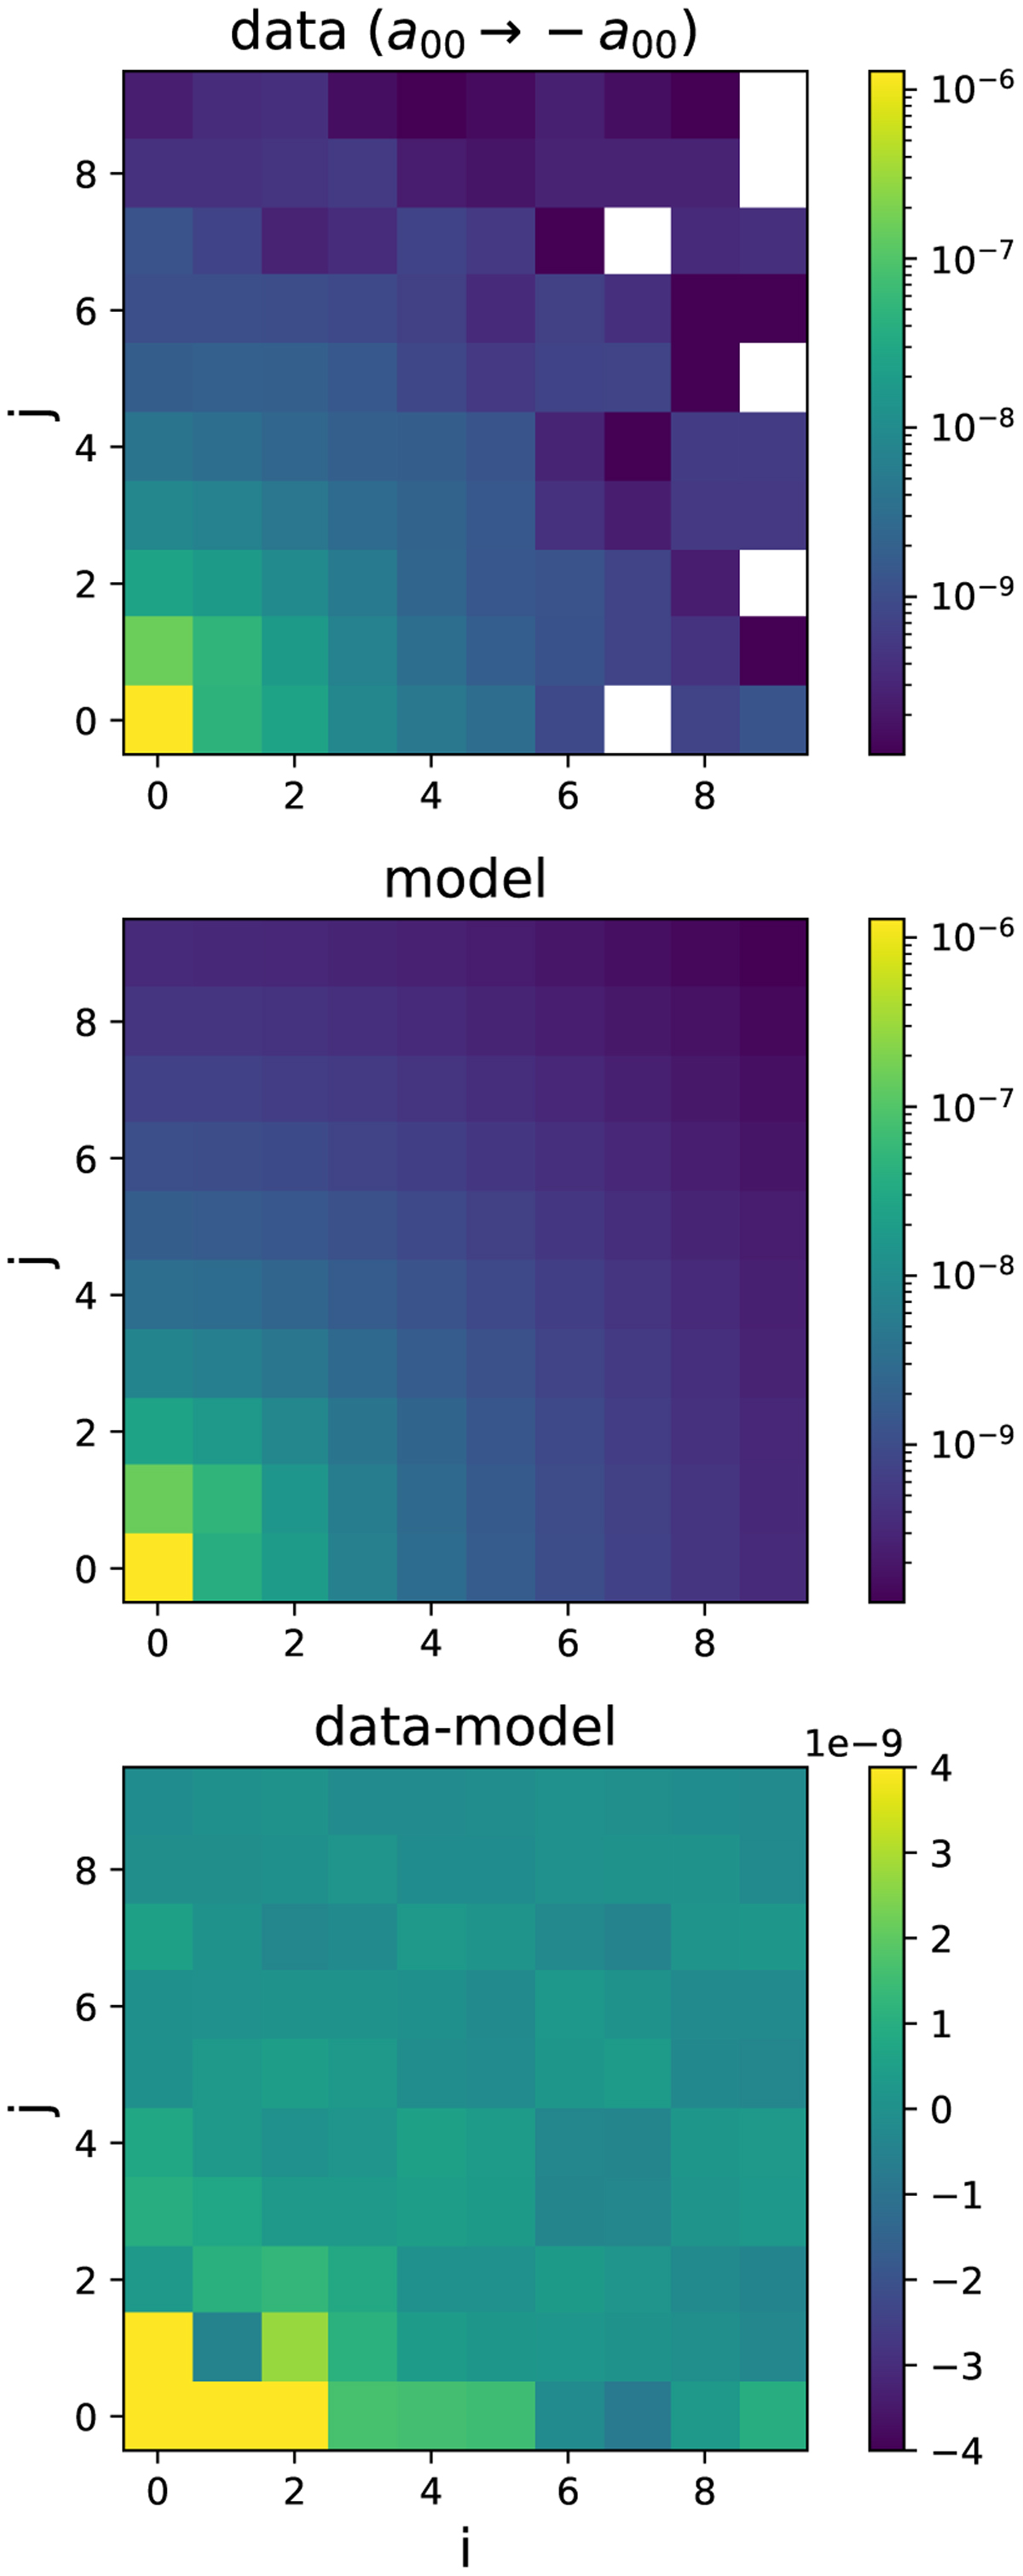
Fig. 11
Download original image
Data (top), fitted electrostatic model (middle), and difference (bottom). The sign of a00 has been flipped in the top plots, but not in the difference. We can note the clear difference of the two nearest neighbors, an anisotropy that is already visible in Fig. 6. We expect a poor fit because the data violates the sum rule, while the fit cannot.
Current usage metrics show cumulative count of Article Views (full-text article views including HTML views, PDF and ePub downloads, according to the available data) and Abstracts Views on Vision4Press platform.
Data correspond to usage on the plateform after 2015. The current usage metrics is available 48-96 hours after online publication and is updated daily on week days.
Initial download of the metrics may take a while.