Open Access
Fig. 12
Download original image
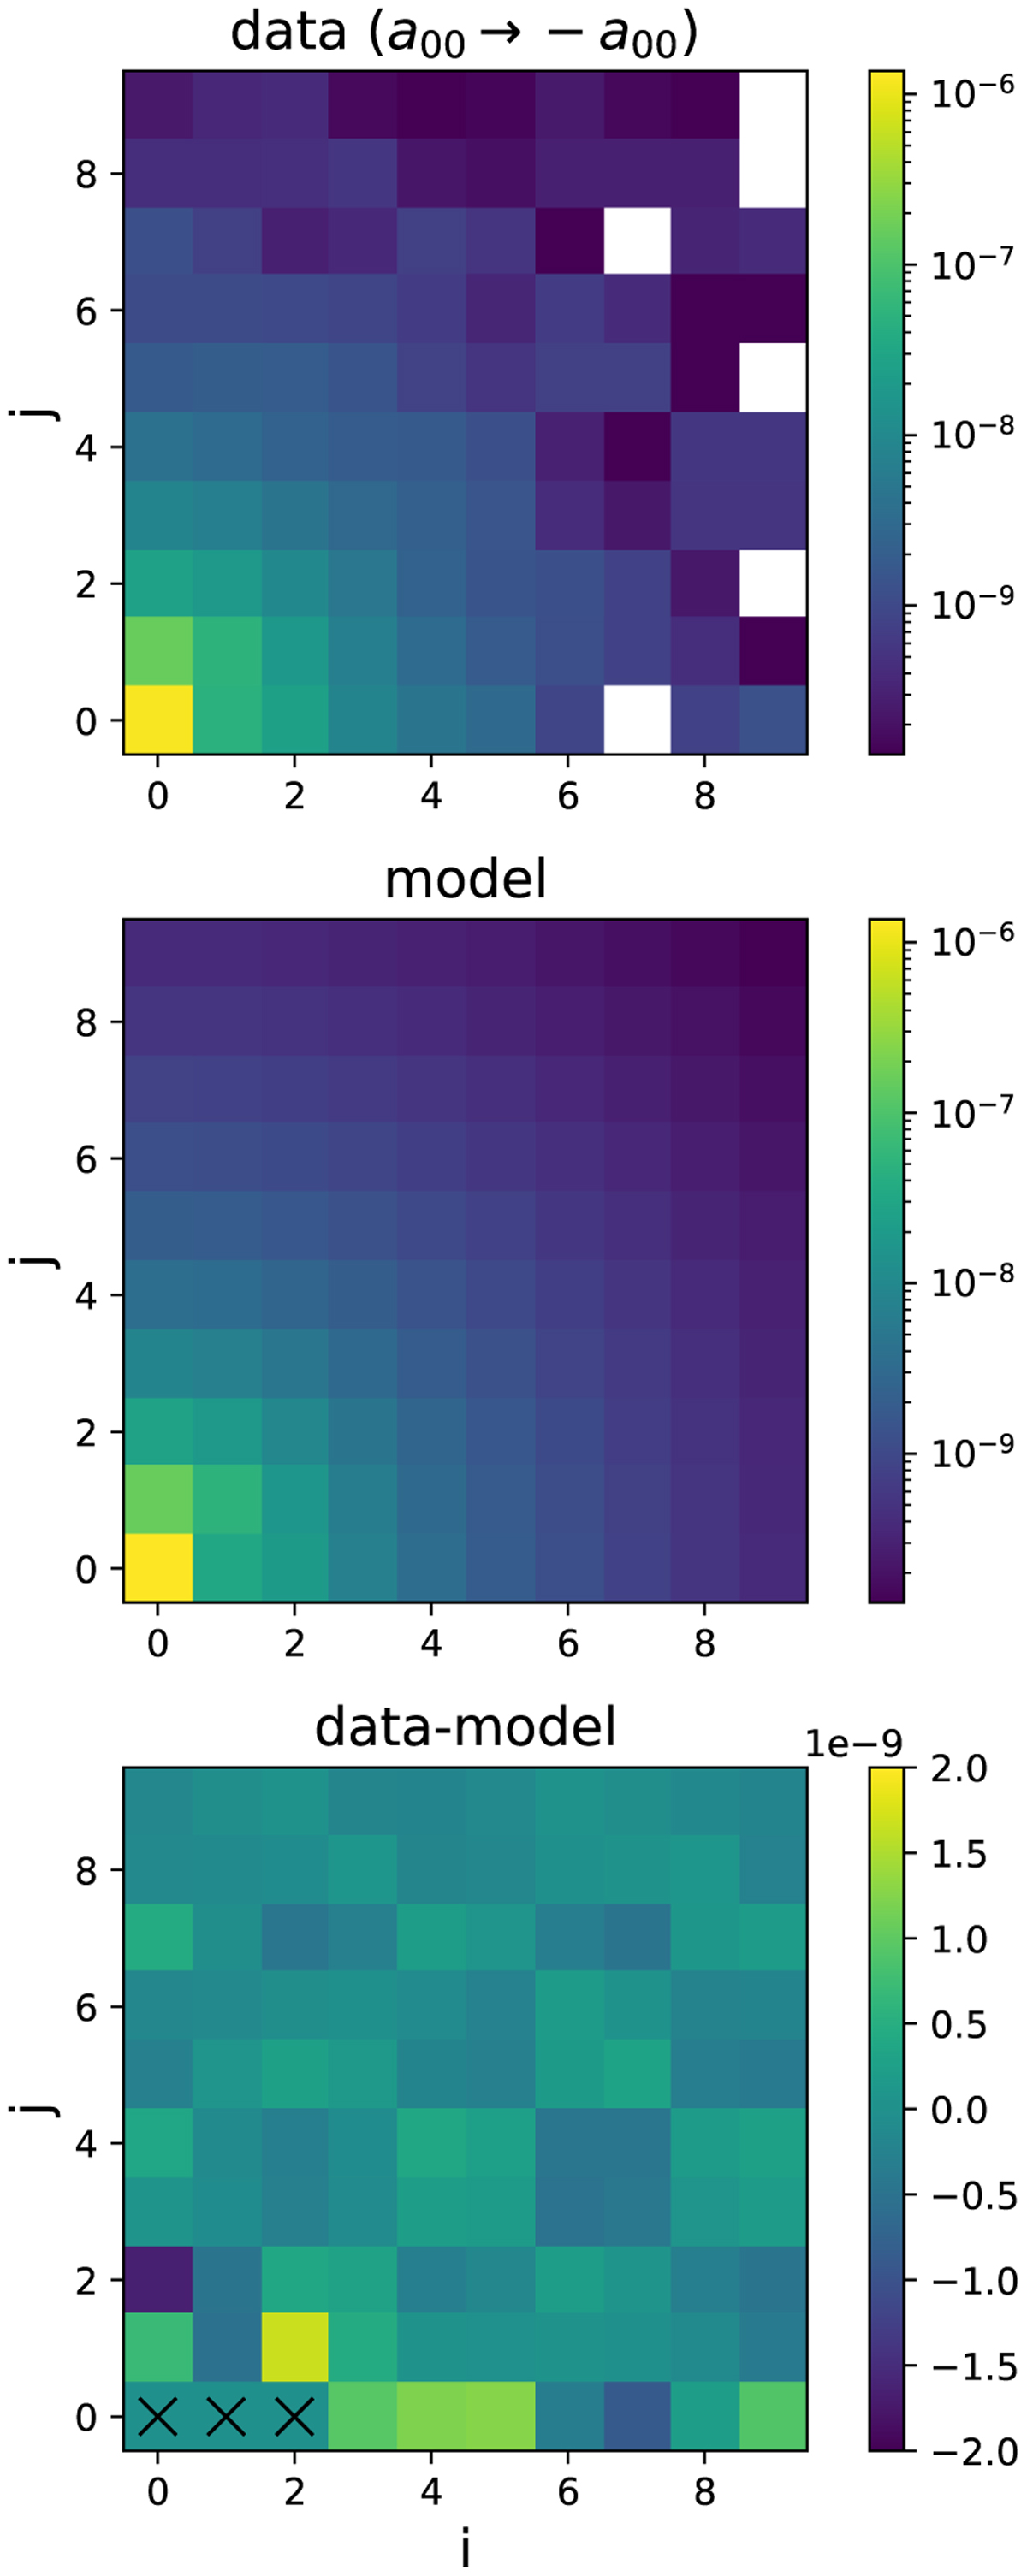
Data (top), fitted electrostatic model (middle), and difference (bottom). This fit ignores the three first serial pixels, marked with crosses in the bottom plot. Compared to Fig. 11, we see that the data excess in a01 has disappeared. We note that the color scale of the difference is zoomed-in, as compared to Fig. 11.
Current usage metrics show cumulative count of Article Views (full-text article views including HTML views, PDF and ePub downloads, according to the available data) and Abstracts Views on Vision4Press platform.
Data correspond to usage on the plateform after 2015. The current usage metrics is available 48-96 hours after online publication and is updated daily on week days.
Initial download of the metrics may take a while.