Fig. 15
Download original image
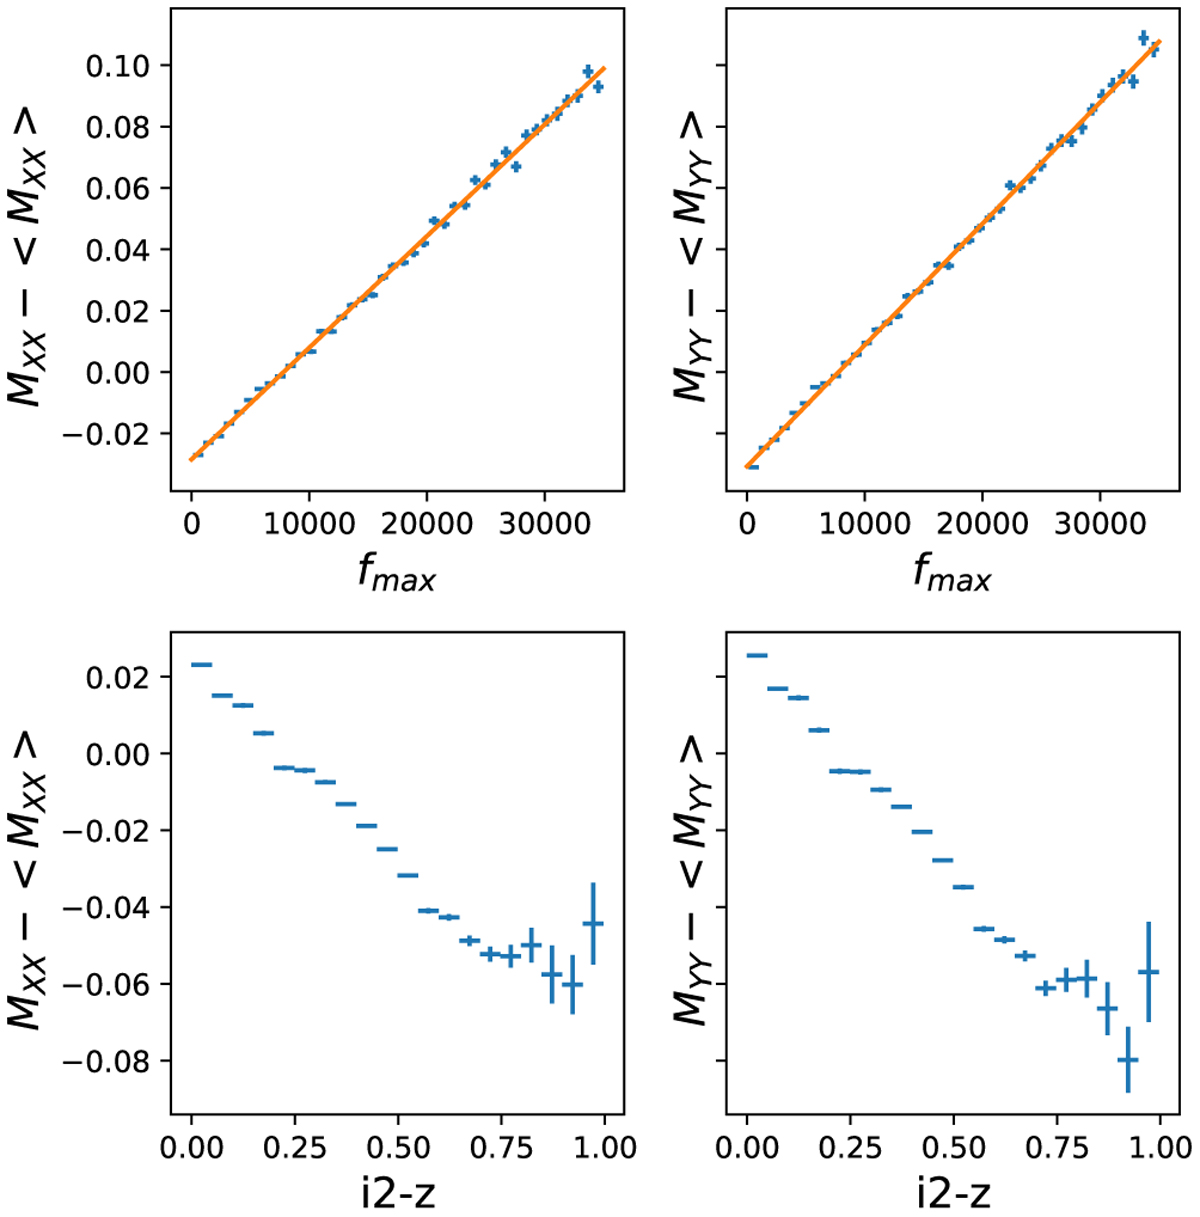
Differences between the star second moments and their expectations from the spatial smoothing, as a function of fmax (top) and color (bottom). We have selected stars with 3 < IQ2 < 4 pix2, in the z band. The color range was chosen so that the color dependence is roughly linear. One can see that the slope of the top right plot is slightly steeper than the top left plot, reflecting the anisotropy of pixel covariances in flat fields.
Current usage metrics show cumulative count of Article Views (full-text article views including HTML views, PDF and ePub downloads, according to the available data) and Abstracts Views on Vision4Press platform.
Data correspond to usage on the plateform after 2015. The current usage metrics is available 48-96 hours after online publication and is updated daily on week days.
Initial download of the metrics may take a while.