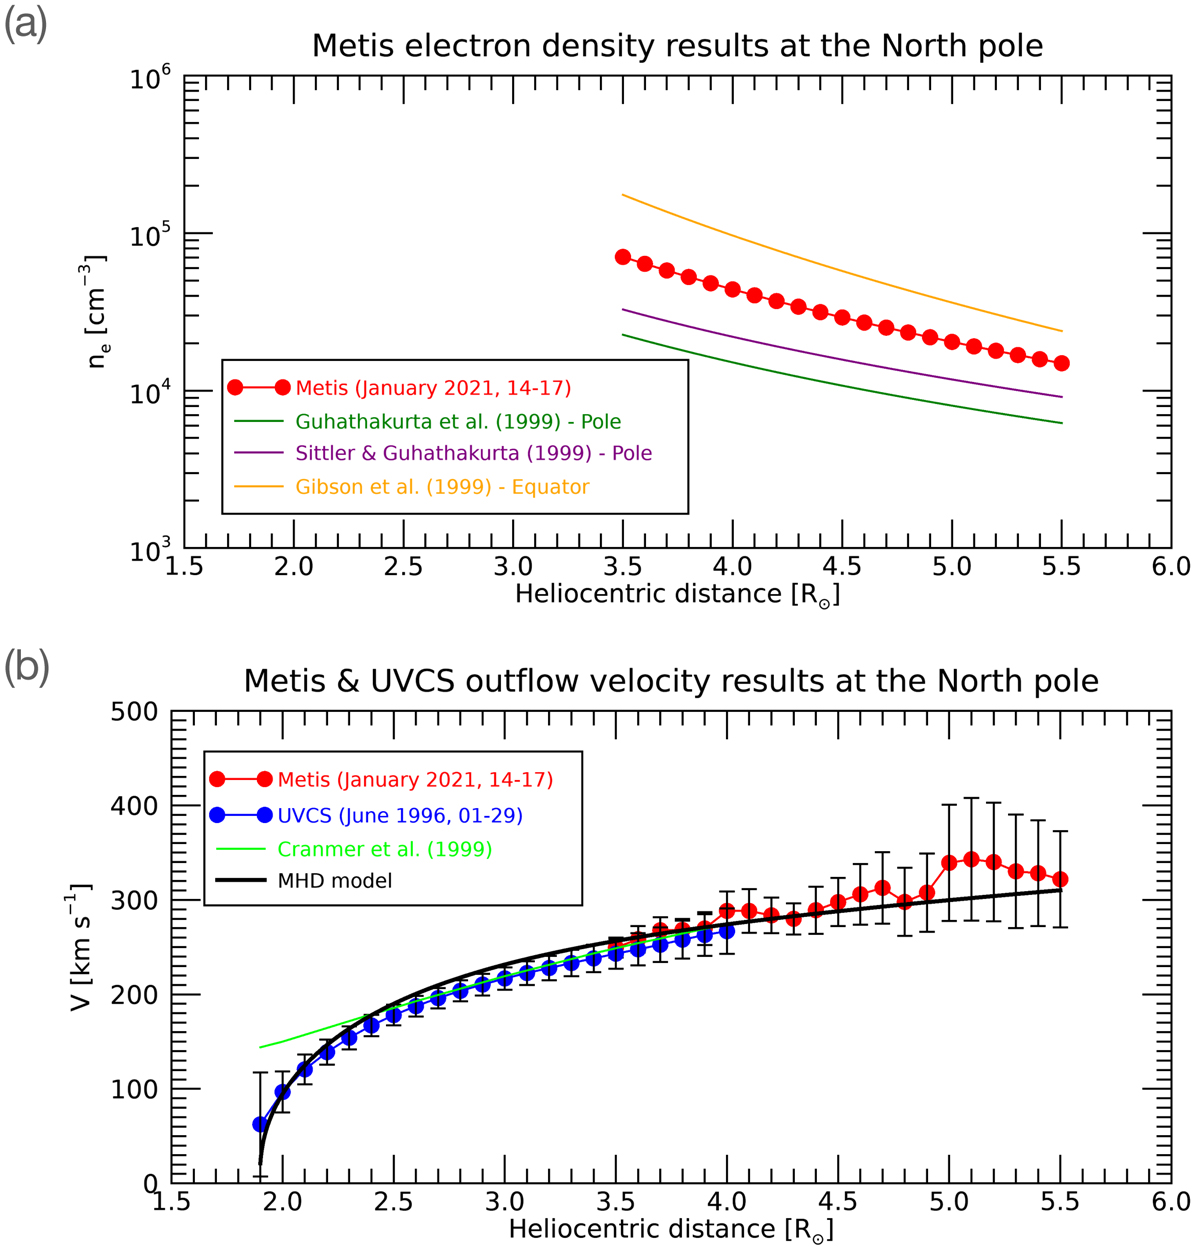
Fig. 2.
Download original image
ne (a) and Vout (b) radial profiles at the north polar coronal hole, as measured with Metis (red dots) and UVCS (blue dots) data, compared with some results from previous literature (marked with different colored lines, as listed in the legend). The thick solid black curve in panel (b) denotes the NI MHD turbulence + SW model applied to the joint UVCS – Metis Vout estimates.
Current usage metrics show cumulative count of Article Views (full-text article views including HTML views, PDF and ePub downloads, according to the available data) and Abstracts Views on Vision4Press platform.
Data correspond to usage on the plateform after 2015. The current usage metrics is available 48-96 hours after online publication and is updated daily on week days.
Initial download of the metrics may take a while.