Fig. 2.
Download original image
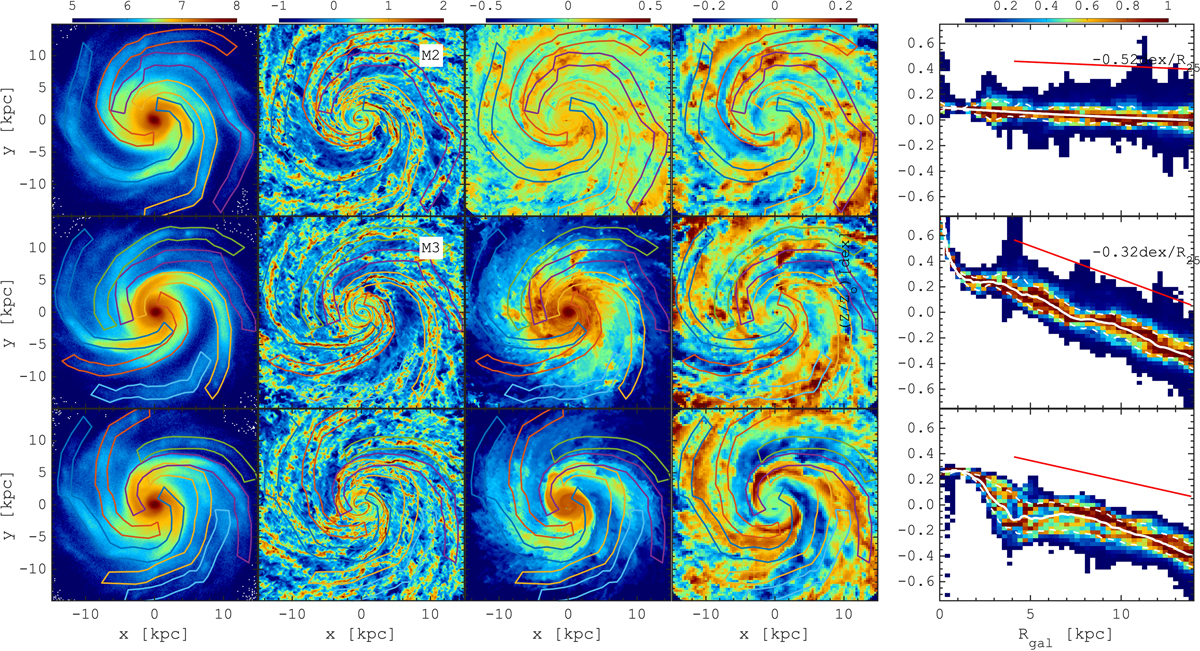
Structure of different models after 0.6 Gyr: M1 (no initial gradient), M2 (both ISM enrichment and gradient) and M3 (only gradient). From left to right: stellar density, gas density, the mean ISM metallicity, residual ISM metallicity (after subtraction of the radial gradient), and the radial metallicity profile. Different models are shown in different rows. Coloured lines highlight the location of the stellar spiral arms measured as a positive overdensity in the first row (see Sect. 3 for details). In the right column, the mean radial metallicity trend is shown by the white solid line. The exponential fit of the radial gradient is shown by the red lines (shifted vertically for better visibility), where R25 = 12 kpc.
Current usage metrics show cumulative count of Article Views (full-text article views including HTML views, PDF and ePub downloads, according to the available data) and Abstracts Views on Vision4Press platform.
Data correspond to usage on the plateform after 2015. The current usage metrics is available 48-96 hours after online publication and is updated daily on week days.
Initial download of the metrics may take a while.