Fig. 18.
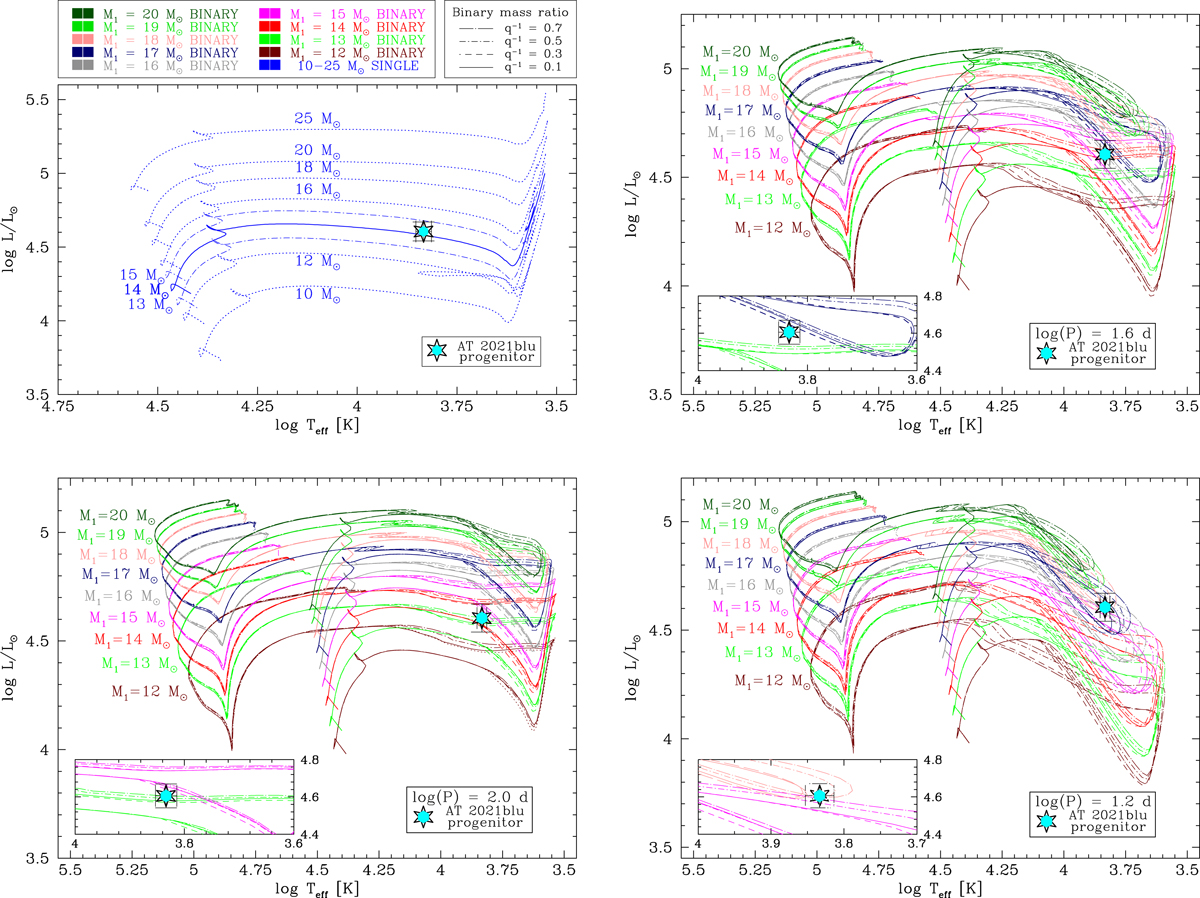
Download original image
Location of the AT 2021blu progenitor in the HRD (cyan starred symbol), and comparison with different solar-metallicity evolutionary tracks. Top-left panel: comparison with evolutionary tracks for single stars. The track of a 14 M⊙ star is indicated with a blue solid line, those of 13 and 15 M⊙ with dot-dashed lines, all other tracks with blue dotted lines. Bottom-left panel: comparison with tracks for binary systems with initial orbital periods P ≈ 100 days (log(P) = 2). Top-right panel: comparison with tracks for binary systems with initial orbital periods P ≈ 40 days (log(P) = 1.6). Bottom-right panel: comparison with tracks for binary systems with initial orbital periods P ≈ 15 days (log(P) = 1.2). Binary tracks with primaries of 12–20 M⊙ are shown as lines with different colours. Binary tracks for different mass ratios (q = M1/M2, where M1 indicates the mass of the primary star and M2 that of the secondary star) are also shown. All tracks are taken from the BPASS database (Eldridge et al. 2017; Stanway & Eldridge 2018). The insets show a close-up view of the location of the AT 2021blu progenitor in the HRD, along with the tracks of different configurations of binaries of 13–18 M⊙ that intersect the error bars of the AT 2021blu progenitor.
Current usage metrics show cumulative count of Article Views (full-text article views including HTML views, PDF and ePub downloads, according to the available data) and Abstracts Views on Vision4Press platform.
Data correspond to usage on the plateform after 2015. The current usage metrics is available 48-96 hours after online publication and is updated daily on week days.
Initial download of the metrics may take a while.