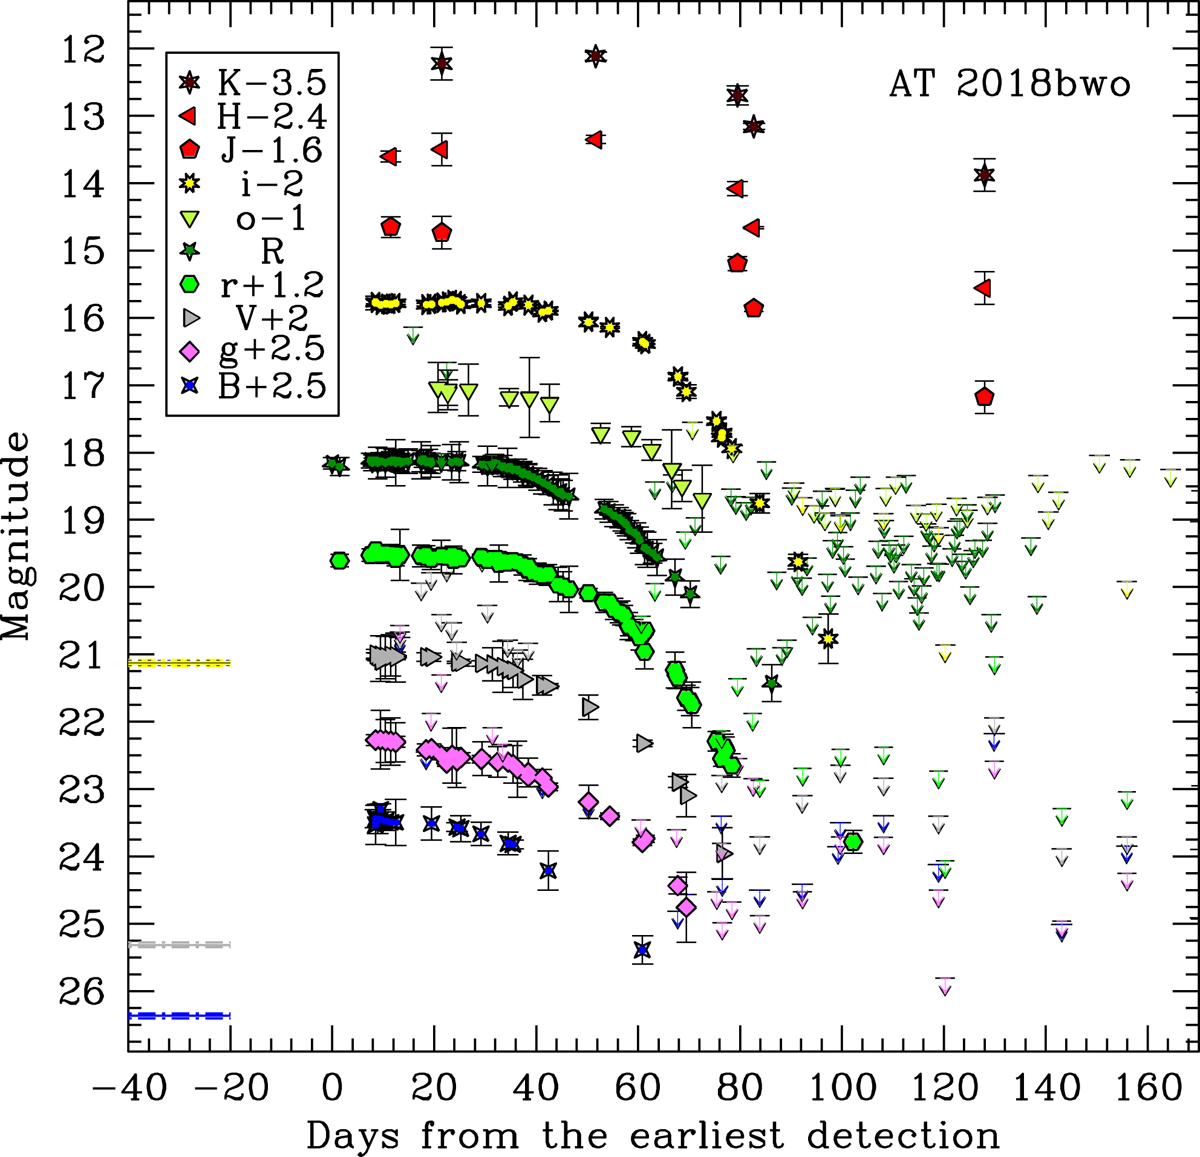
Fig. 2.
Download original image
AT 2018bwo optical and NIR photometry. The light curves include selected data from the public surveys and from Blagorodnova et al. (2021) to fill our observational gaps. The very few data points in the ATLAS-c band are not shown. The solid lines on the left represent the magnitudes of the quiescent progenitor from Blagorodnova et al. (2021), converted to Johnson-Cousins B, V, and I following the prescriptions of Harris (2018). To facilitate the comparison with the i-band light curve of AT 2018bwo, the I-band magnitude of the progenitor is reported in the AB magnitude system. The dot-dashed lines represent the uncertainties in the progenitor detections, which are of ∼0.04 mag in all filters. The phases are in days from the earliest LRN detection (MJD = 59252.9).
Current usage metrics show cumulative count of Article Views (full-text article views including HTML views, PDF and ePub downloads, according to the available data) and Abstracts Views on Vision4Press platform.
Data correspond to usage on the plateform after 2015. The current usage metrics is available 48-96 hours after online publication and is updated daily on week days.
Initial download of the metrics may take a while.