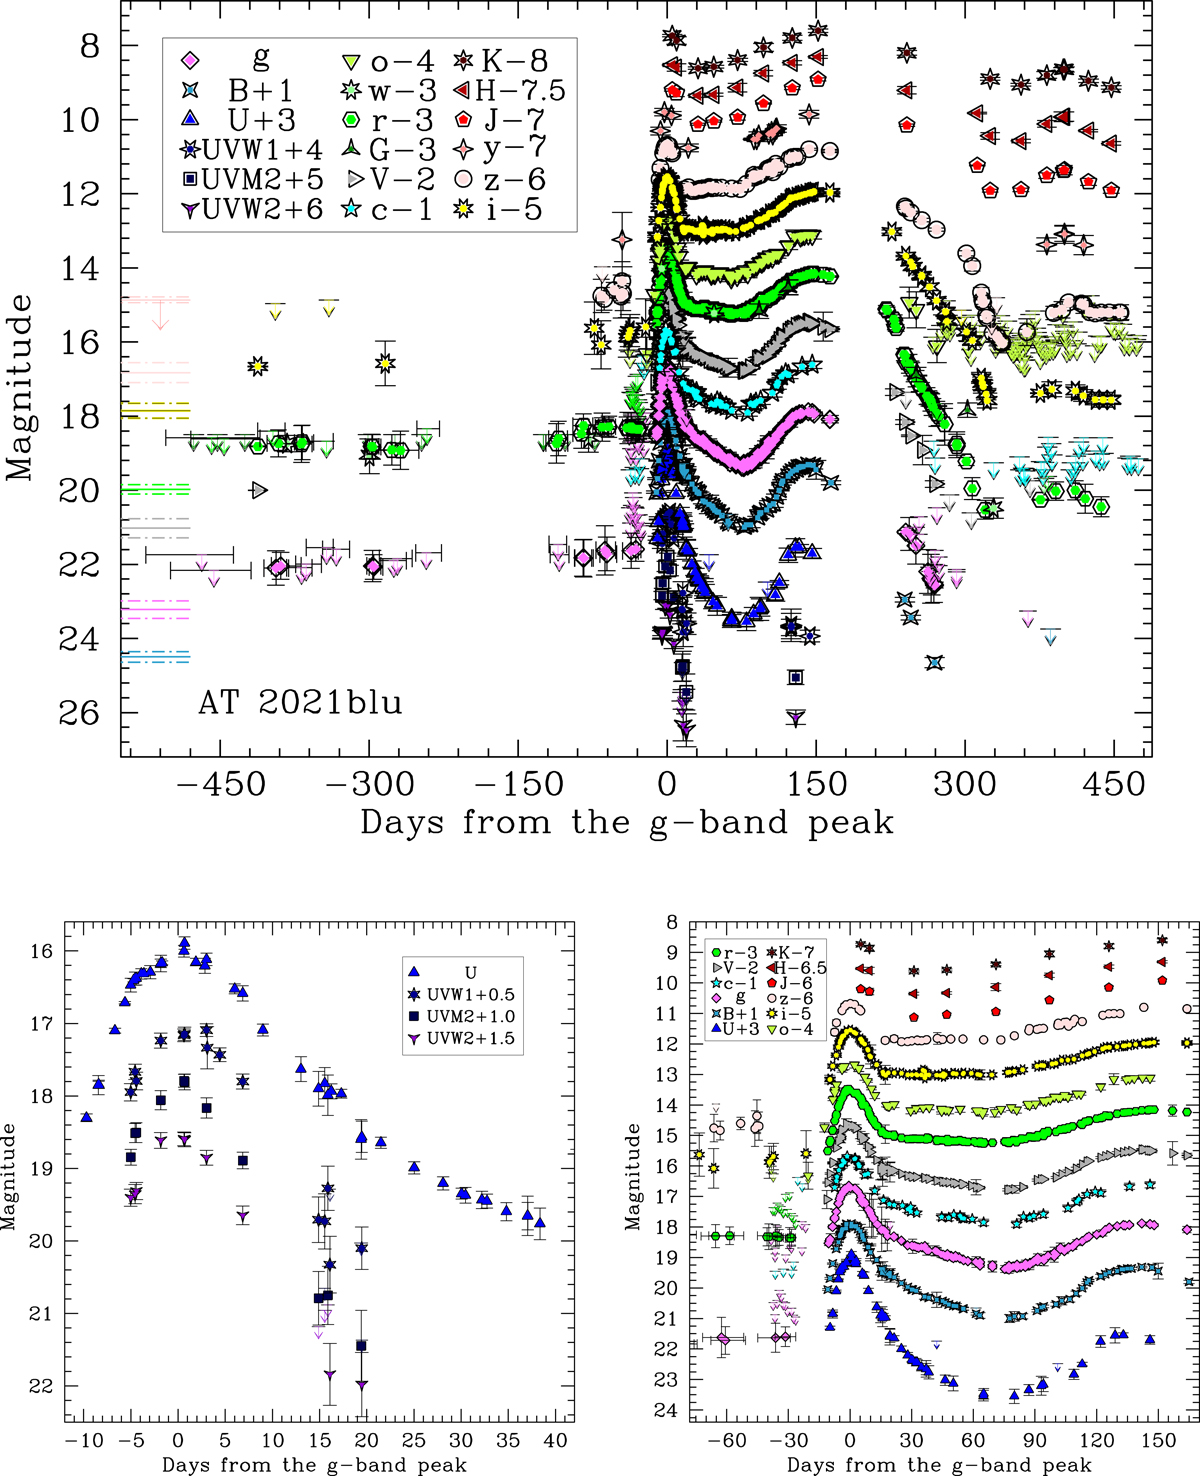
Fig. 4.
Download original image
Photometric evolution of AT 2021blu. Top panel: long-term light curves in all filters. Transformation relations from Jester et al. (2005) are used to convert Sloan u-band photometry to Johnson-Bessell U. The solid lines on the left represent the magnitudes of the quiescent progenitor of AT 2021blu. The down arrows represent upper detection limits. The dot-dashed lines represent the uncertainties of the progenitor detections in the different bands (see Table 1). Bottom-left panel: close-up view of the peak of the outburst in the UV bands. Bottom-right panel: detail of the LRN light curves in the optical and NIR bands from −75 d to +170 d from the g-band peak (MJD = 59258.89). Data from the public surveys are also included.
Current usage metrics show cumulative count of Article Views (full-text article views including HTML views, PDF and ePub downloads, according to the available data) and Abstracts Views on Vision4Press platform.
Data correspond to usage on the plateform after 2015. The current usage metrics is available 48-96 hours after online publication and is updated daily on week days.
Initial download of the metrics may take a while.