Fig. 5.
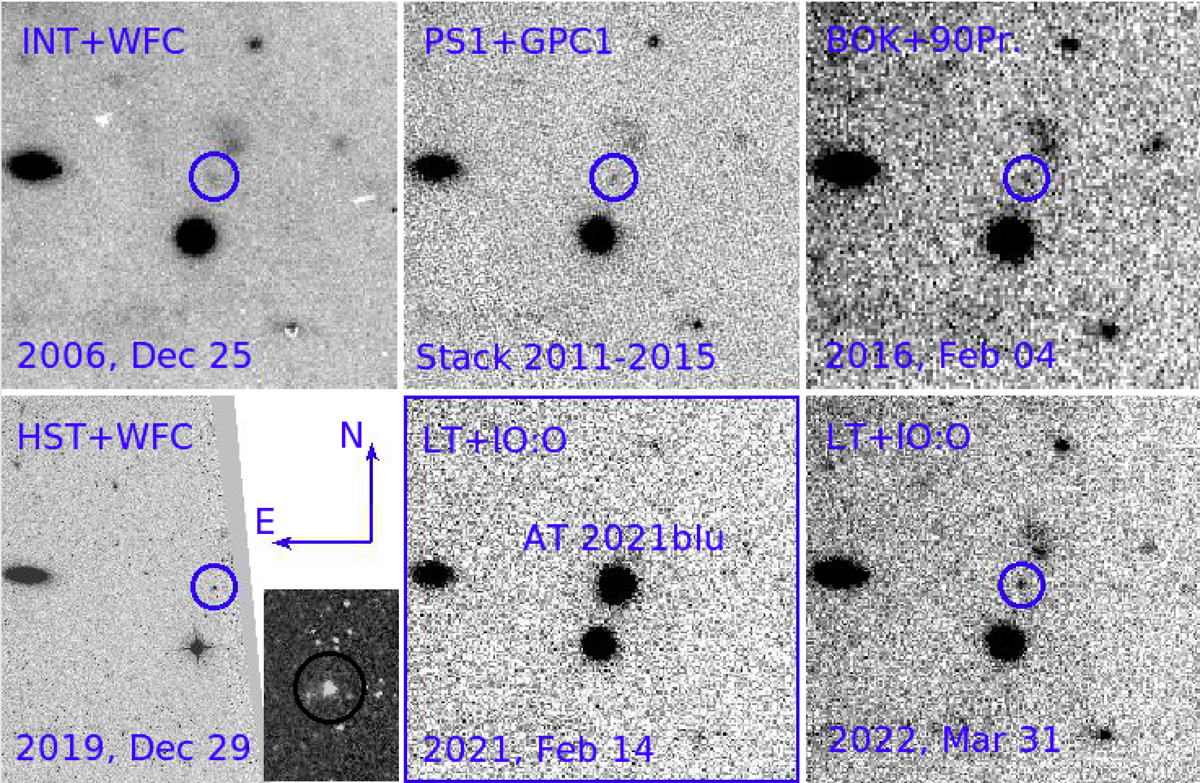
Download original image
Evolution with time of the source coincident with the position of AT 2021blu in the Sloan r-band. From 2006 to 2016 (top panels) the source is barely detected, with negligible magnitude changes. In late 2019 (bottom-left panel), the source is imaged by HST in the F606W filter, and it is about 1 mag brighter than in the decade before. LT images show AT 2021blu in outburst (in February 2021, approximately at maximum; bottom-middle panel), and at very late phases (late March 2022; bottom-right panel).
Current usage metrics show cumulative count of Article Views (full-text article views including HTML views, PDF and ePub downloads, according to the available data) and Abstracts Views on Vision4Press platform.
Data correspond to usage on the plateform after 2015. The current usage metrics is available 48-96 hours after online publication and is updated daily on week days.
Initial download of the metrics may take a while.