Open Access
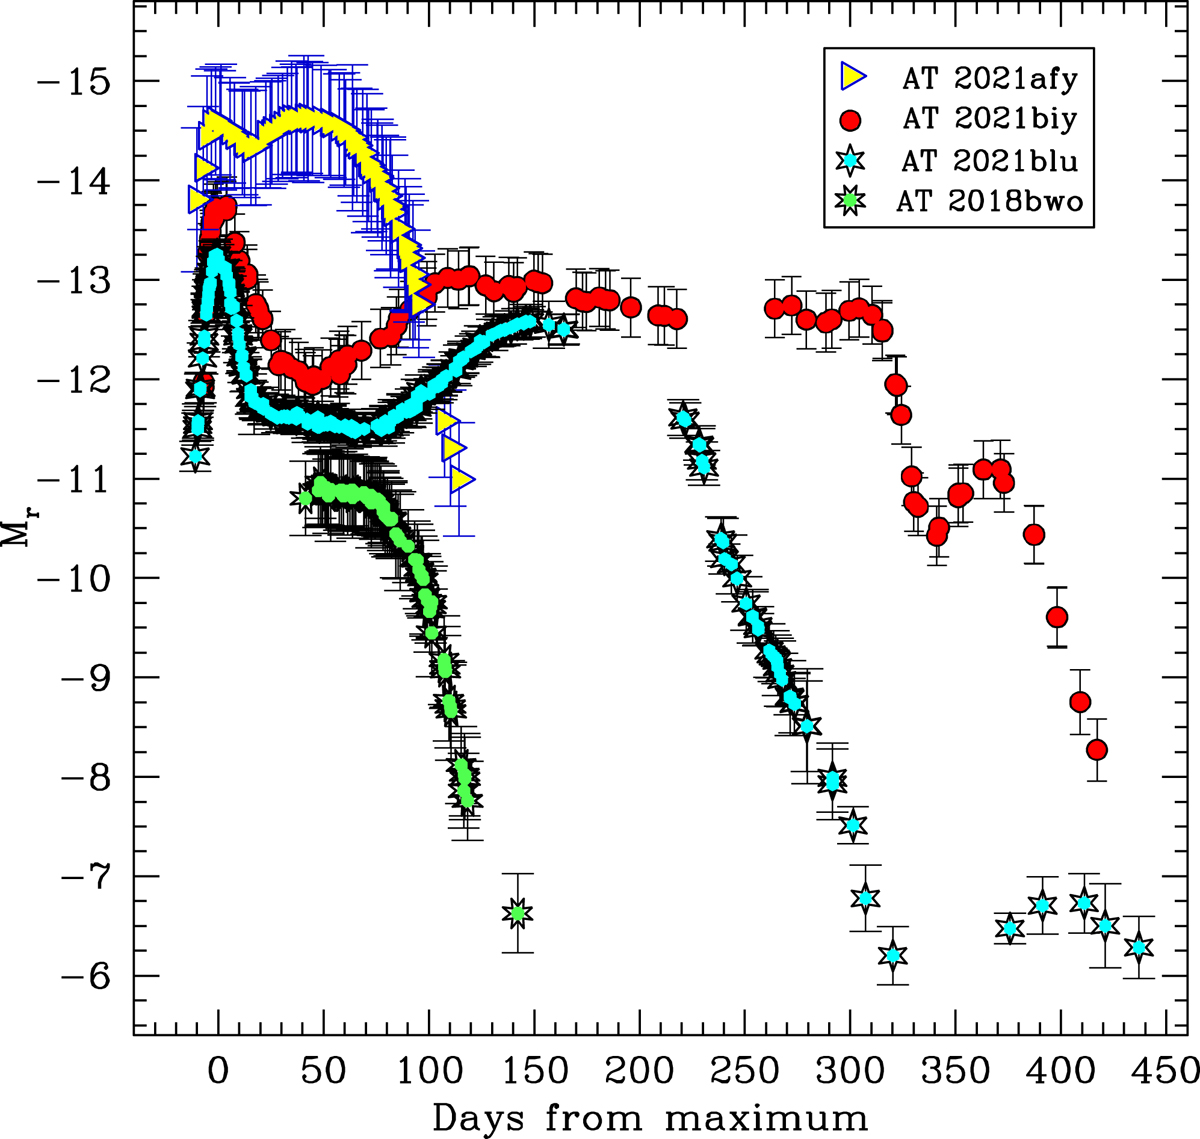
Fig. 6.
Download original image
Comparison of the Sloan r-band absolute light curves of the three LRNe discussed in this paper with that of AT 2021biy (Cai et al. 2022b). For phasing AT 2018bwo, we assume that the early light curve maximum occurred 40 d before the earliest DLT40 detection of the transient (Sect. 3.1, and Table A.1).
Current usage metrics show cumulative count of Article Views (full-text article views including HTML views, PDF and ePub downloads, according to the available data) and Abstracts Views on Vision4Press platform.
Data correspond to usage on the plateform after 2015. The current usage metrics is available 48-96 hours after online publication and is updated daily on week days.
Initial download of the metrics may take a while.