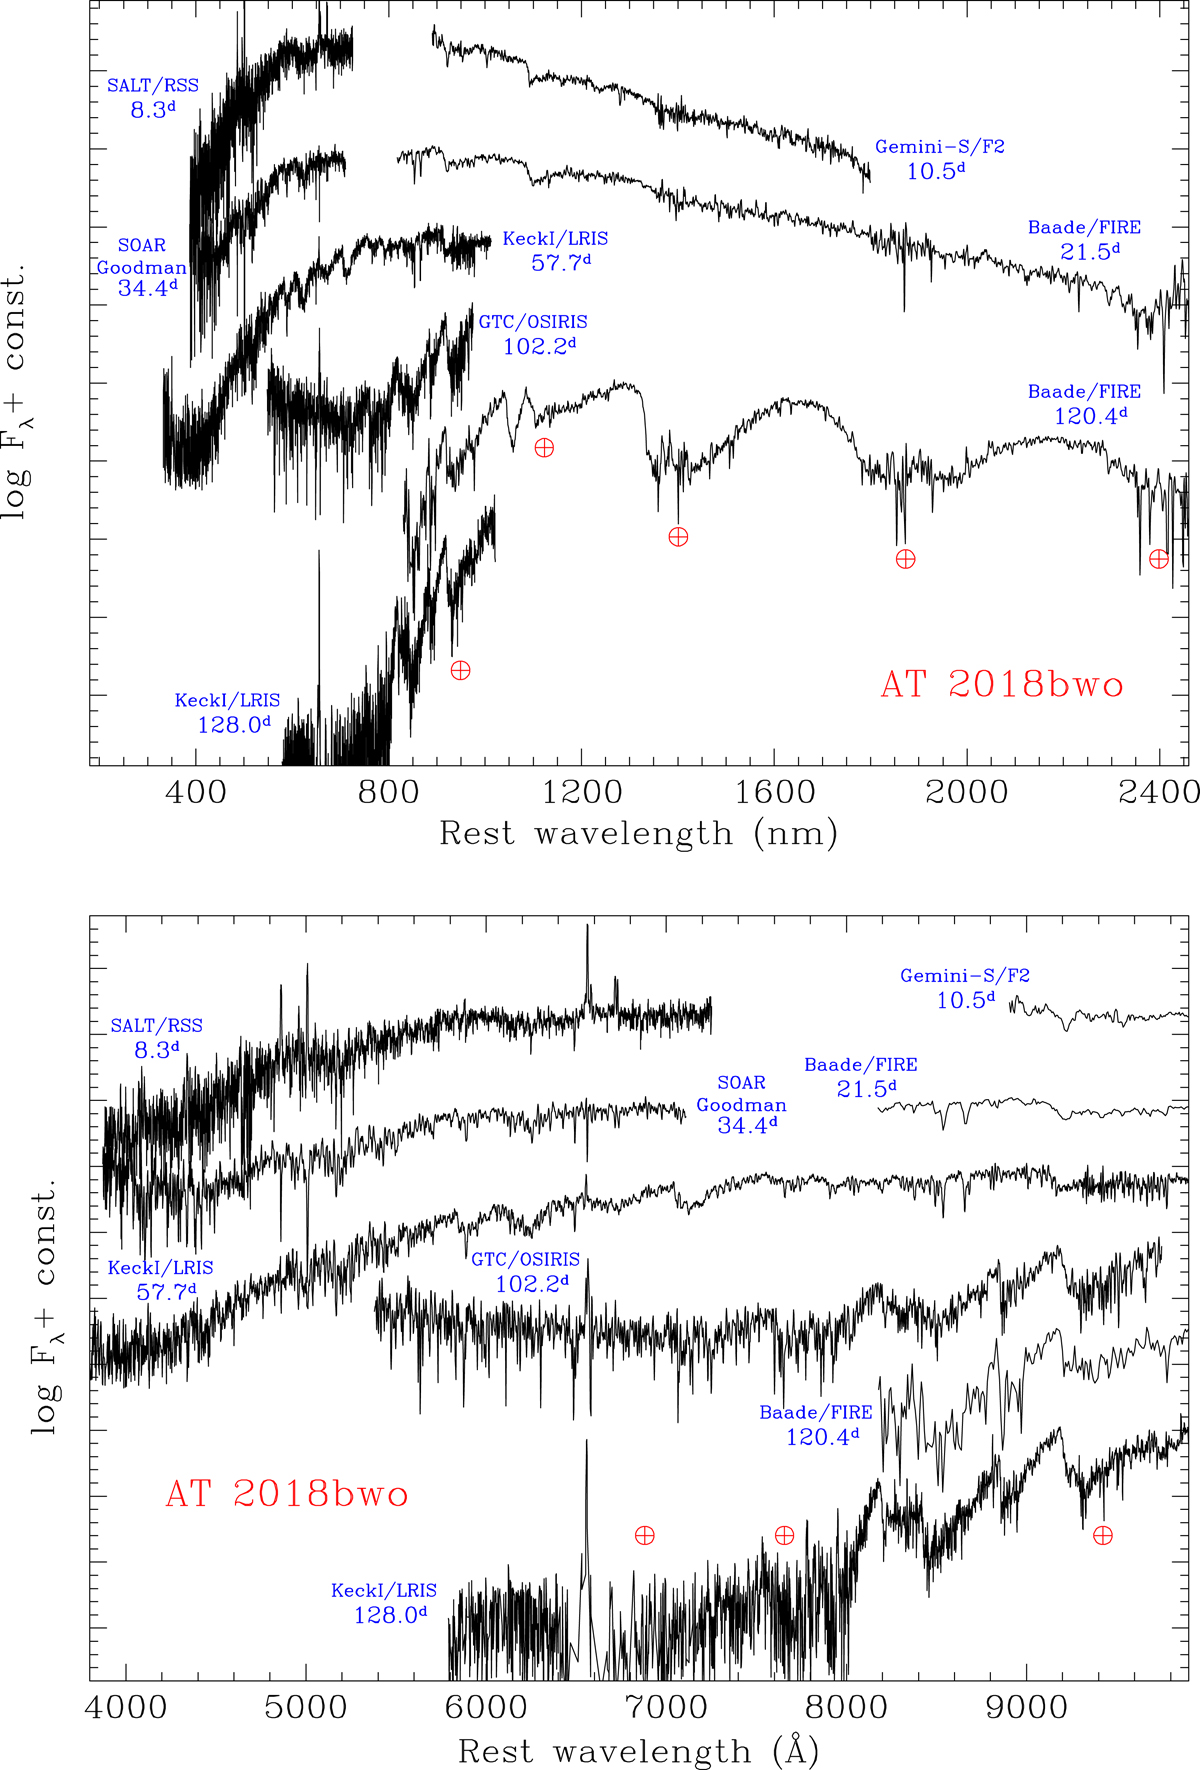
Fig. 9.
Download original image
Optical and NIR spectra of AT 2018bwo, corrected for the redshift (z = 0.001558) and for the reddening (E(B − V)MW = 0.02 mag). Top panel: full wavelength range. Bottom panel: close-up view of the spectral set in the optical domain. The instrumental configurations and the phases from the earliest detection are also reported. We remark that the epoch of the outburst onset adopted in Sect. 4 was 40 days earlier.
Current usage metrics show cumulative count of Article Views (full-text article views including HTML views, PDF and ePub downloads, according to the available data) and Abstracts Views on Vision4Press platform.
Data correspond to usage on the plateform after 2015. The current usage metrics is available 48-96 hours after online publication and is updated daily on week days.
Initial download of the metrics may take a while.