Fig. 10
Download original image
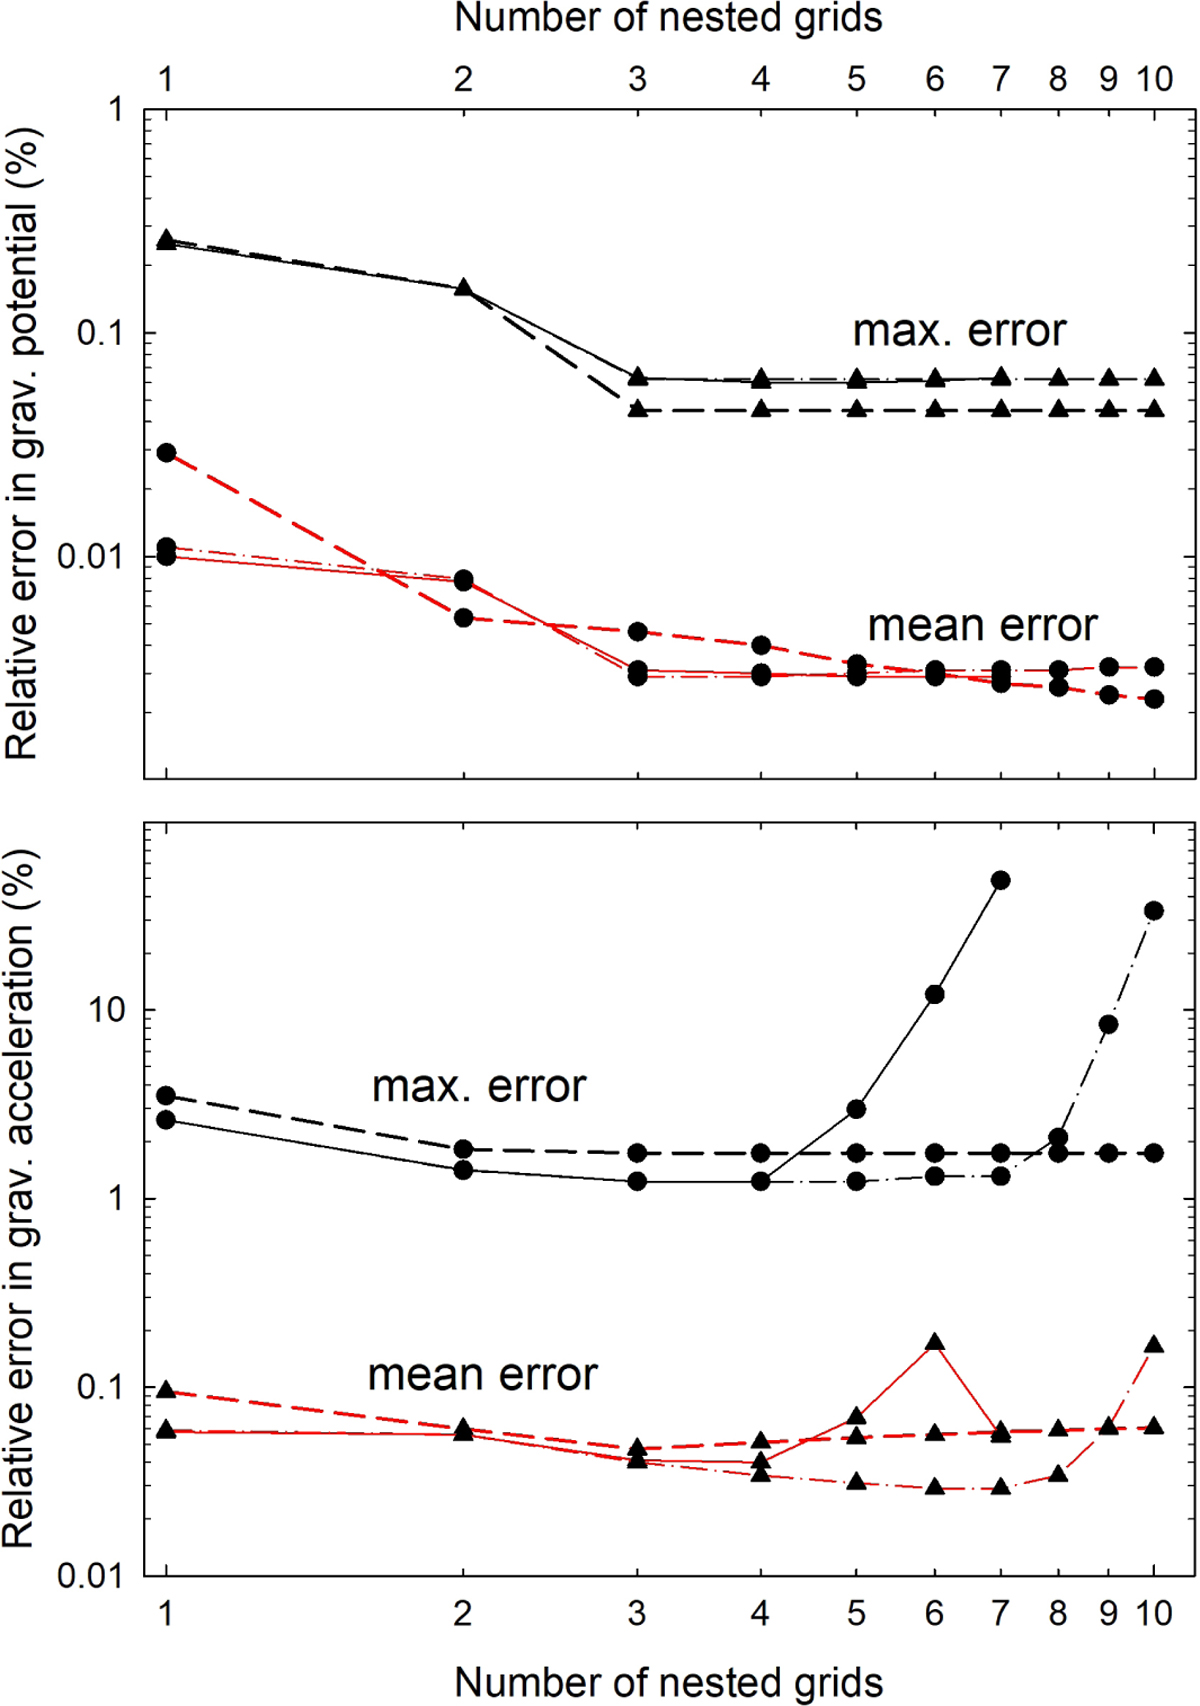
Relative errors for the gravitational potential (top panel) and gravitational acceleration (bottom panel) for the oblate ellipsoid as a function of the number of nested grids. The black and red lines present the maximum and mean errors, respectively. The dashed lines correspond to the convolution method, while the solid and dash-dotted lines show the results for the OiCG method with the tolerance ϵ set equal to 10−6 and 10−8, respectively.
Current usage metrics show cumulative count of Article Views (full-text article views including HTML views, PDF and ePub downloads, according to the available data) and Abstracts Views on Vision4Press platform.
Data correspond to usage on the plateform after 2015. The current usage metrics is available 48-96 hours after online publication and is updated daily on week days.
Initial download of the metrics may take a while.