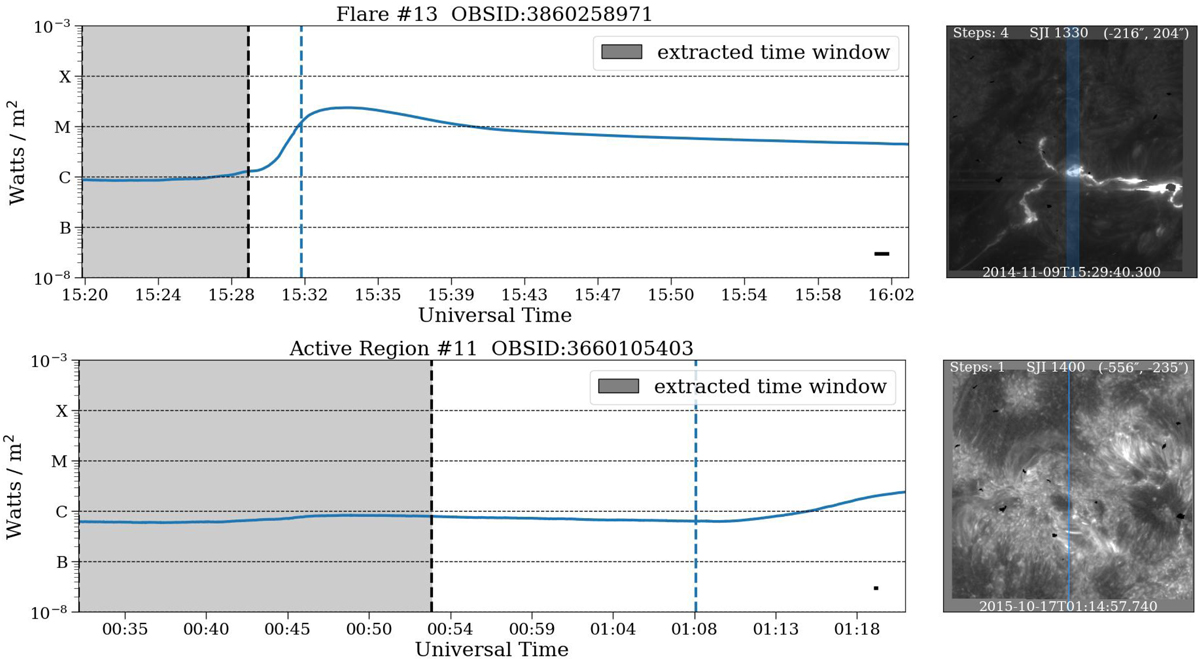
Fig. 1.
Download original image
Example of data collection for a single PF (top) and AR (bottom) observation. Mg II spectra in both cases were extracted from the gray time interval. For context a SJI is included for each observation at the time roughly indicated by the vertical dashed blue line. The blue curves in the time plots indicate the integrated GOES flux in the 1 − 8 Å channel, while the blue regions in the SJI indicate the span of the raster, with a four step raster for the PF observation and a sit-and-stare for the AR observation. The length of each observation’s raster cadence in time is indicated by the thick black lines in the bottom right hand corner of each panel.
Current usage metrics show cumulative count of Article Views (full-text article views including HTML views, PDF and ePub downloads, according to the available data) and Abstracts Views on Vision4Press platform.
Data correspond to usage on the plateform after 2015. The current usage metrics is available 48-96 hours after online publication and is updated daily on week days.
Initial download of the metrics may take a while.