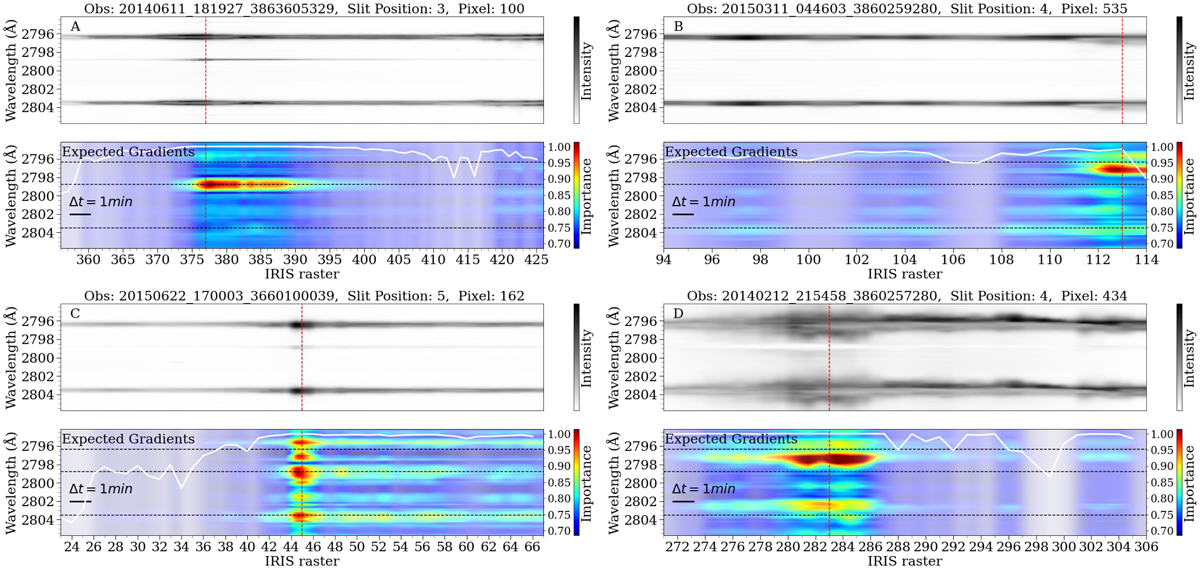
Fig. 12.
Download original image
Four spectrograms (labeled A-D) in black and white and their associated saliency maps as calculated using Expected Gradients. Darker shades in the spectrograms indicate higher intensities, while warmer colors, such as reds and oranges in the attribution maps are linked to features that the model believes are important for flare prediction. Each attribution map was normalized such that their colors are comparable. The position of the h&k-line cores, as well as the red wing subordinate line are indicated by horizontal black dashed lines in the attribution maps. Panel A through D shows that triplet emission, downflows, broad line cores, and highly asymmetric spectra respectively, are indicative of forthcoming flares according to the model.
Current usage metrics show cumulative count of Article Views (full-text article views including HTML views, PDF and ePub downloads, according to the available data) and Abstracts Views on Vision4Press platform.
Data correspond to usage on the plateform after 2015. The current usage metrics is available 48-96 hours after online publication and is updated daily on week days.
Initial download of the metrics may take a while.