Open Access
Fig. A.3
Download original image
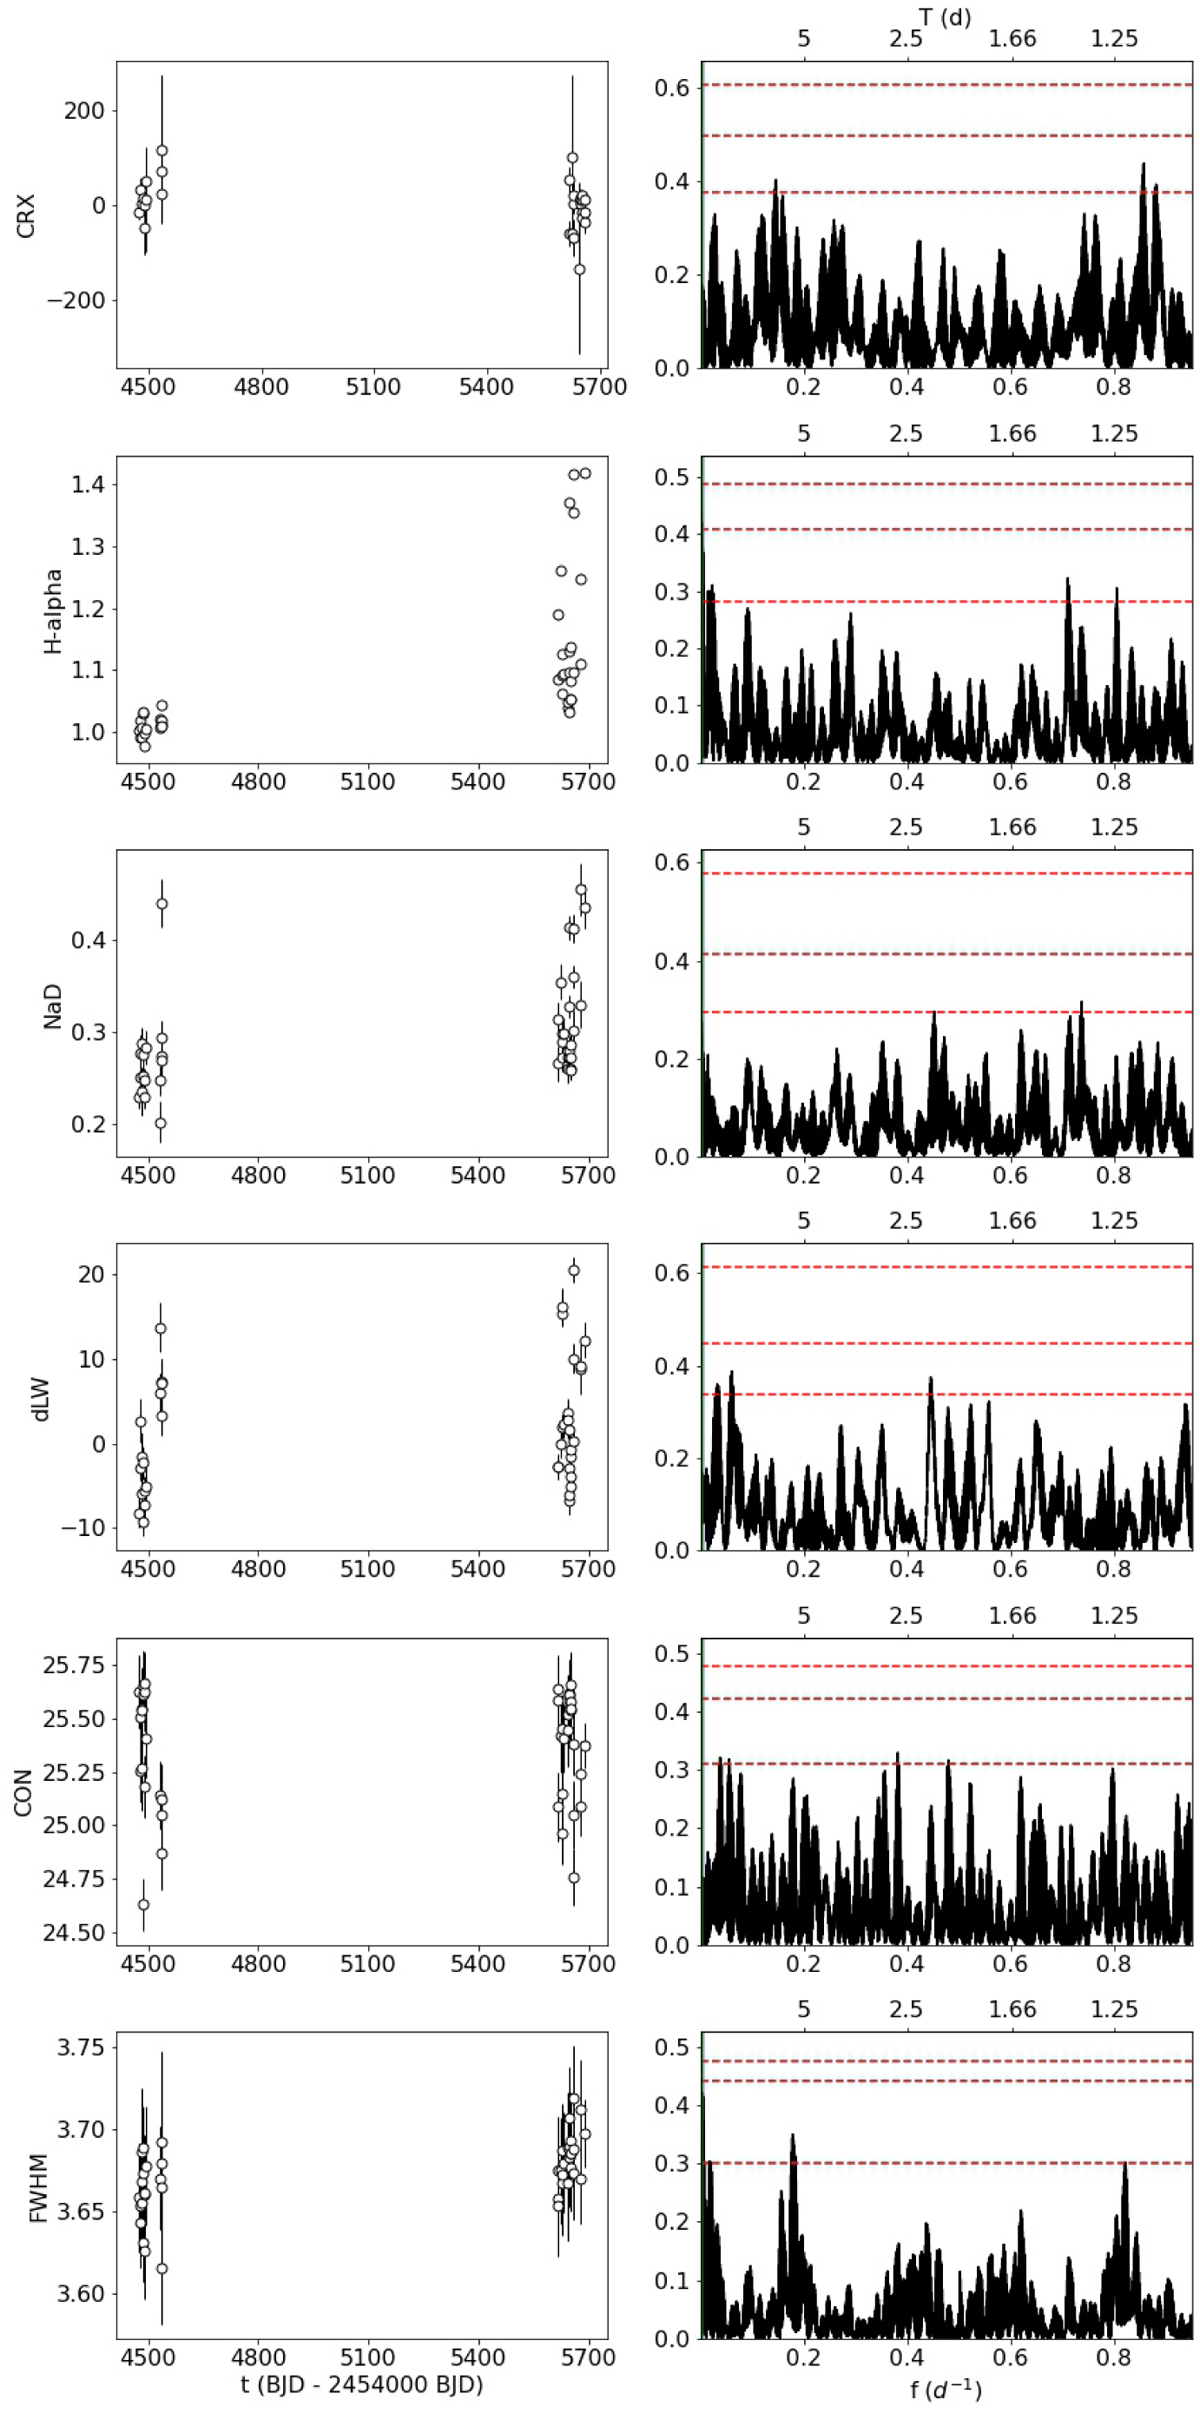
Spectroscopic index time-series data from HARPS-N, none of which show any significant signals. Since the periodograms are dominated by the window function, the low-frequency part is not shown. From top to bottom this is as indicated CRX, Hα, Na I D, dLw, FWHM, and CON indices. Further details in Fig. A.1.
Current usage metrics show cumulative count of Article Views (full-text article views including HTML views, PDF and ePub downloads, according to the available data) and Abstracts Views on Vision4Press platform.
Data correspond to usage on the plateform after 2015. The current usage metrics is available 48-96 hours after online publication and is updated daily on week days.
Initial download of the metrics may take a while.