Fig. 2
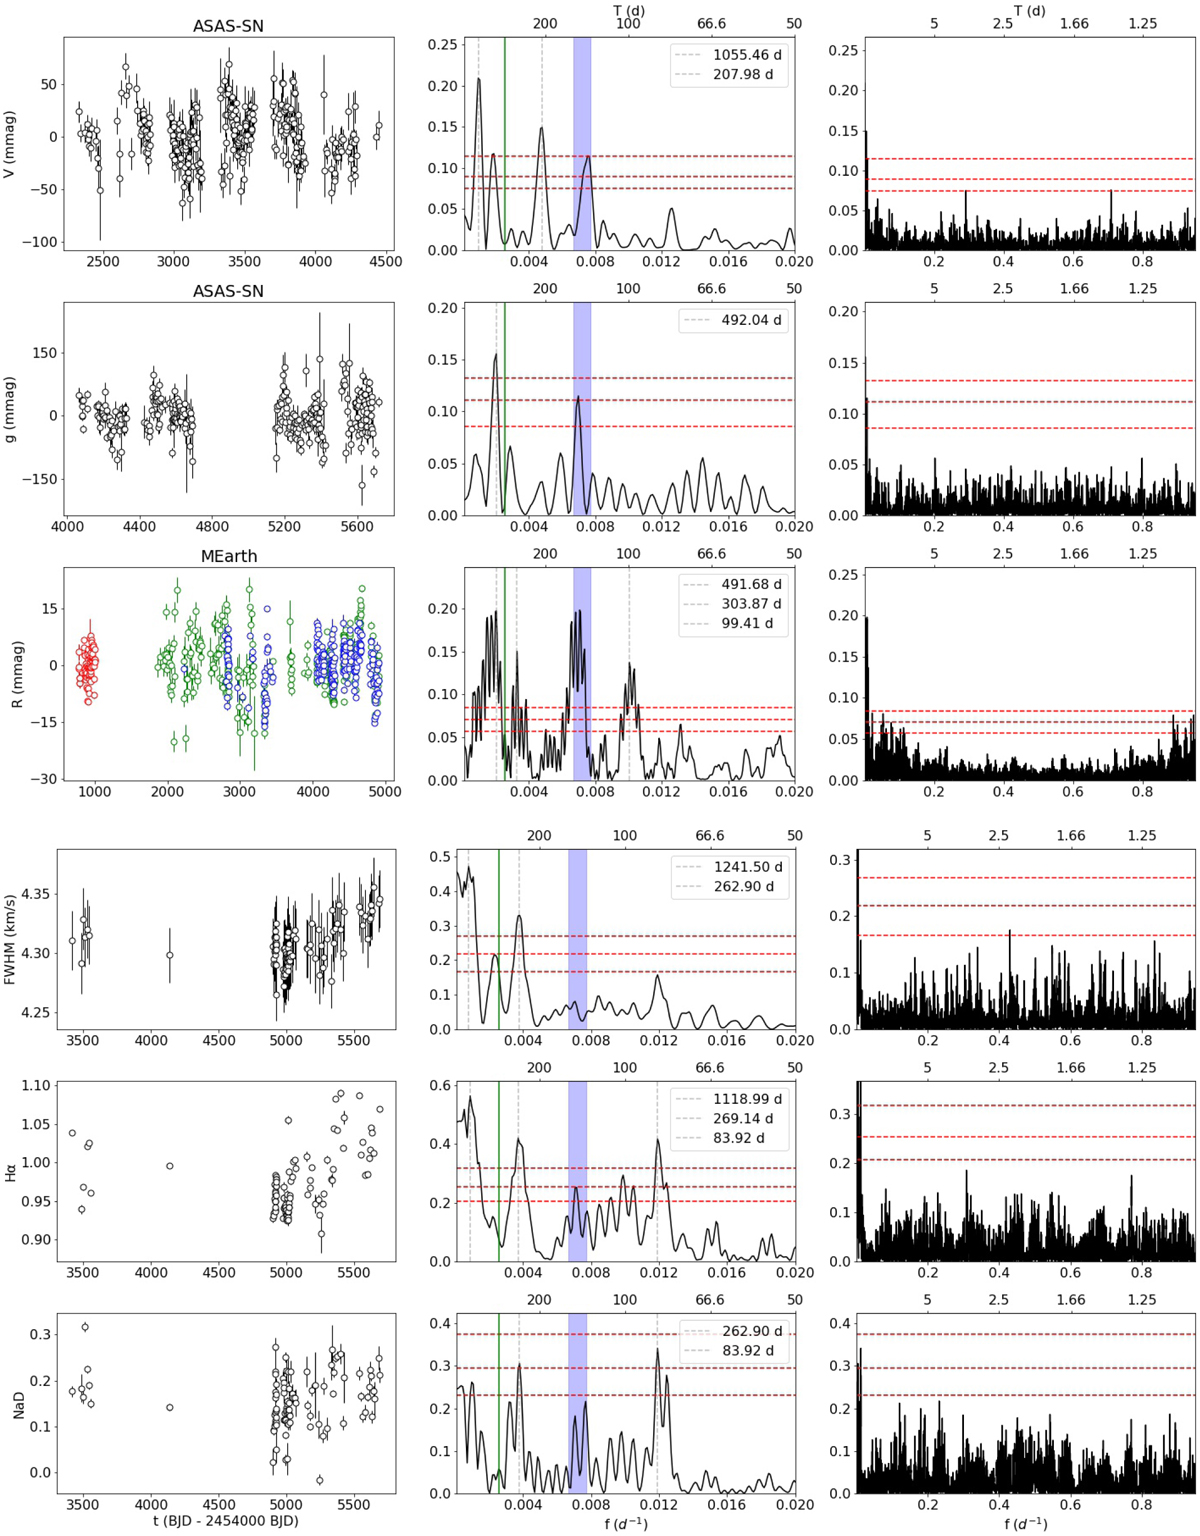
Download original image
Photometric and spectral index time series. Significant signals are marked. We show the full dataset (left panels) and their periodograms for longer periods (>50 d, middle panels) and for all periods (right panels). The grey vertical dashed lines mark the significant peaks. We show the period of the planet in green and the rotational period of the star at 140±10d in blue. For the combined MEarth data, we show the different individual sets in colours. The red dashed horizontal lines show the FAP levels of 10, 1, and 0.1%.
Current usage metrics show cumulative count of Article Views (full-text article views including HTML views, PDF and ePub downloads, according to the available data) and Abstracts Views on Vision4Press platform.
Data correspond to usage on the plateform after 2015. The current usage metrics is available 48-96 hours after online publication and is updated daily on week days.
Initial download of the metrics may take a while.