Fig. 3
Download original image
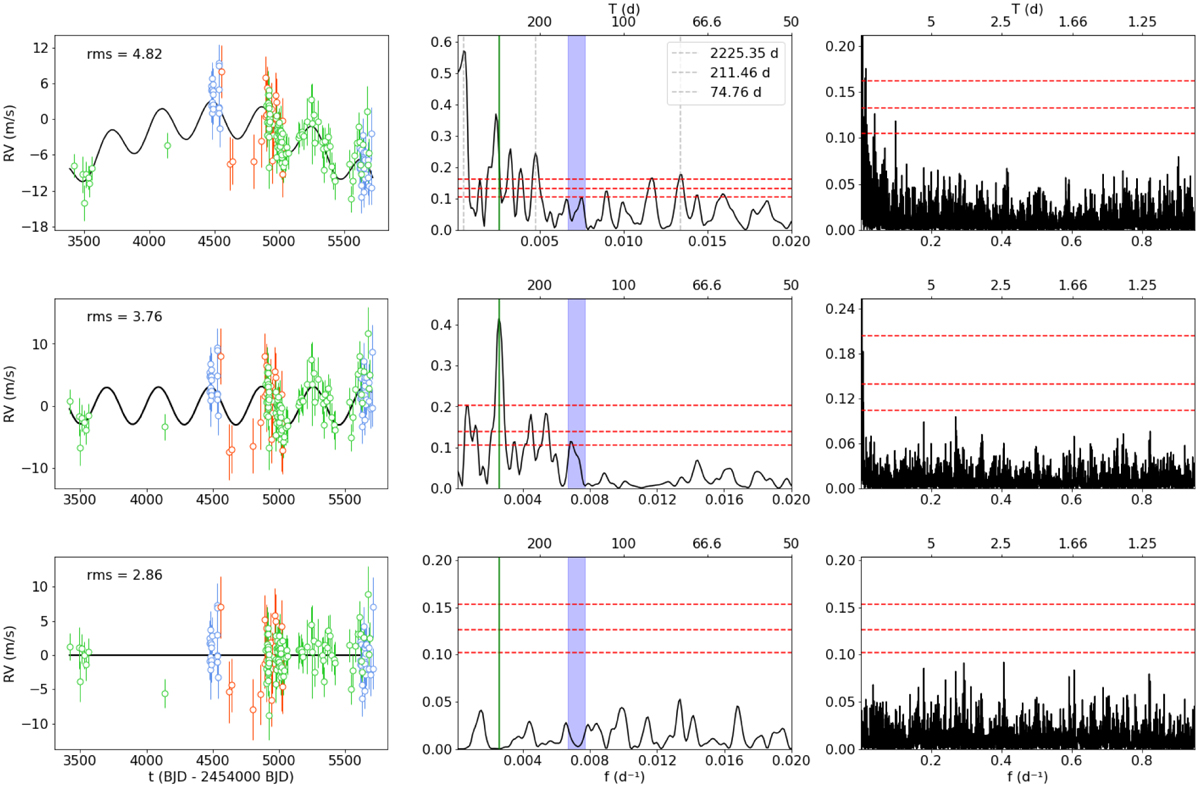
RV time-series data (left panels) and periodograms (red dashed lines as the 0.1, 1, and 10% FAP levels) of the best-fitting model consisting of a sinusoid and a parabola. The middle panels show the low-frequency portion of the periodograms (P > 50 d) and we mark the rotational period at 140, including its uncertainty of ± 10 d, with the blue vertical area, and the planetary period at 390 d with the green vertical line. In the right panel, the full periodogram is shown. In the top panels, we show the data as observed (green: CARMENES, red: HPF, blue: HARPS-N) and indicate the best-fitting model by the black curve. The middle row shows the RV residuals after the subtraction of the parabola. The bottom row shows the residuals of the best fit and we provide the RV rms.
Current usage metrics show cumulative count of Article Views (full-text article views including HTML views, PDF and ePub downloads, according to the available data) and Abstracts Views on Vision4Press platform.
Data correspond to usage on the plateform after 2015. The current usage metrics is available 48-96 hours after online publication and is updated daily on week days.
Initial download of the metrics may take a while.