Fig. 6
Download original image
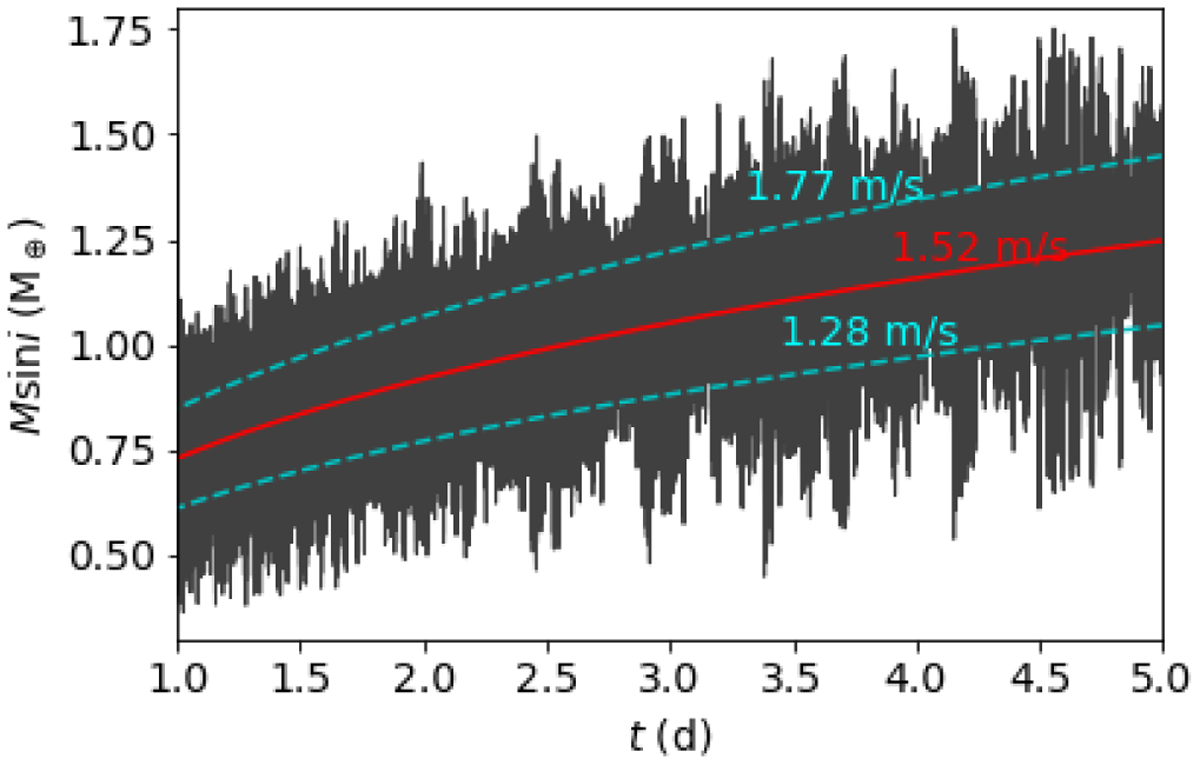
Detection limits of the RV residuals for the period of the assumed low-mass planet responsible for the LOFAR signal, after subtracting the best-fitting model consisting of the effect of GJ 1151 c and an additional quadratic polynomial. The black lines correspond to the minimum masses of the planetary signals as recovered by the simulations. The red line corresponds to the minimum mass of the average limiting semiamplitude along with its standard deviation limits in blue.
Current usage metrics show cumulative count of Article Views (full-text article views including HTML views, PDF and ePub downloads, according to the available data) and Abstracts Views on Vision4Press platform.
Data correspond to usage on the plateform after 2015. The current usage metrics is available 48-96 hours after online publication and is updated daily on week days.
Initial download of the metrics may take a while.