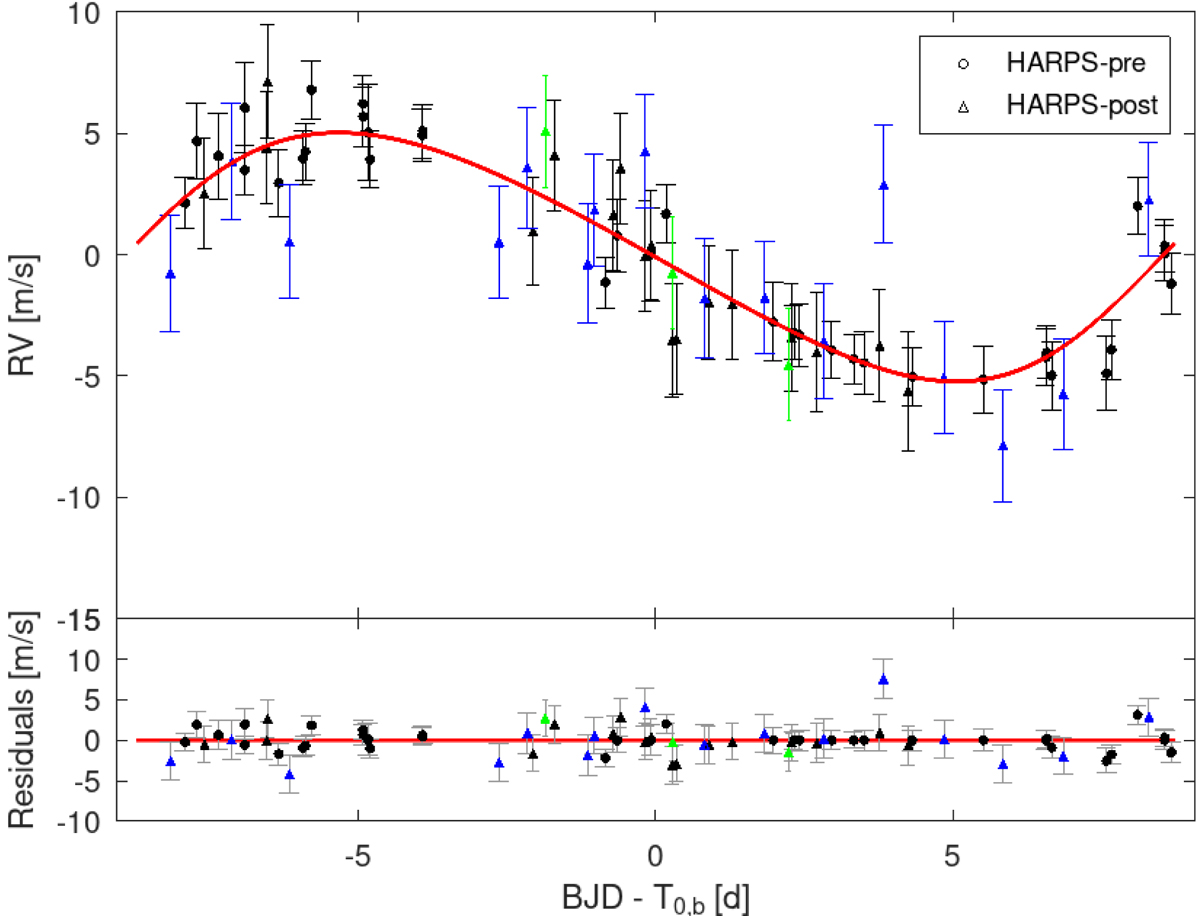
Fig. 2.
Download original image
Phase-folded RV signal produced by TOI-1055 b with the best-fit Keplerian model superimposed (red). Marker colours distinguish the subsample used by P21 (black), the further three data points used by G21 (green), and the additional 16 data points we acquired. Instead, the marker shapes distinguish the measurement acquired before (HARPS-pre) and after (HARPS-post) the instrument upgrade. Error bars include the estimated jitter contributions.
Current usage metrics show cumulative count of Article Views (full-text article views including HTML views, PDF and ePub downloads, according to the available data) and Abstracts Views on Vision4Press platform.
Data correspond to usage on the plateform after 2015. The current usage metrics is available 48-96 hours after online publication and is updated daily on week days.
Initial download of the metrics may take a while.