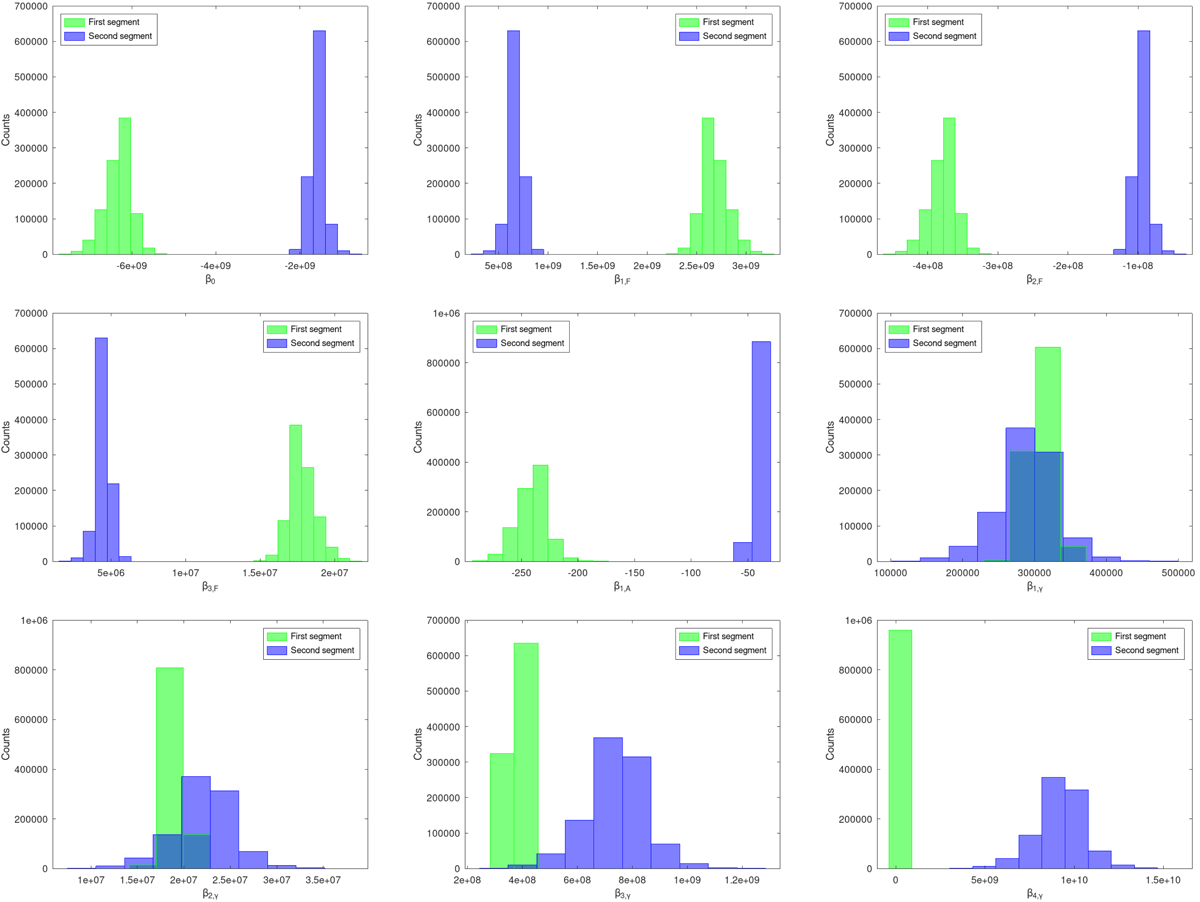
Fig. A.3.
Download original image
Distributions inferred a posteriori for the activity-related detrending coefficients (i.e. β0, β⋅, F, β⋅, A, and β⋅, γ of Eq. (1); the digit in the subscript refers to the polynomial order). Each panel compares the optimal detrending coefficients applied to the two different piecewise stationary segments that were found within the HARPS-pre dataset. The difference between the two distributions of each parameter emphasises that stellar activity impacts the RV observations differently when moving from one segment to the other.
Current usage metrics show cumulative count of Article Views (full-text article views including HTML views, PDF and ePub downloads, according to the available data) and Abstracts Views on Vision4Press platform.
Data correspond to usage on the plateform after 2015. The current usage metrics is available 48-96 hours after online publication and is updated daily on week days.
Initial download of the metrics may take a while.