Fig. 11.
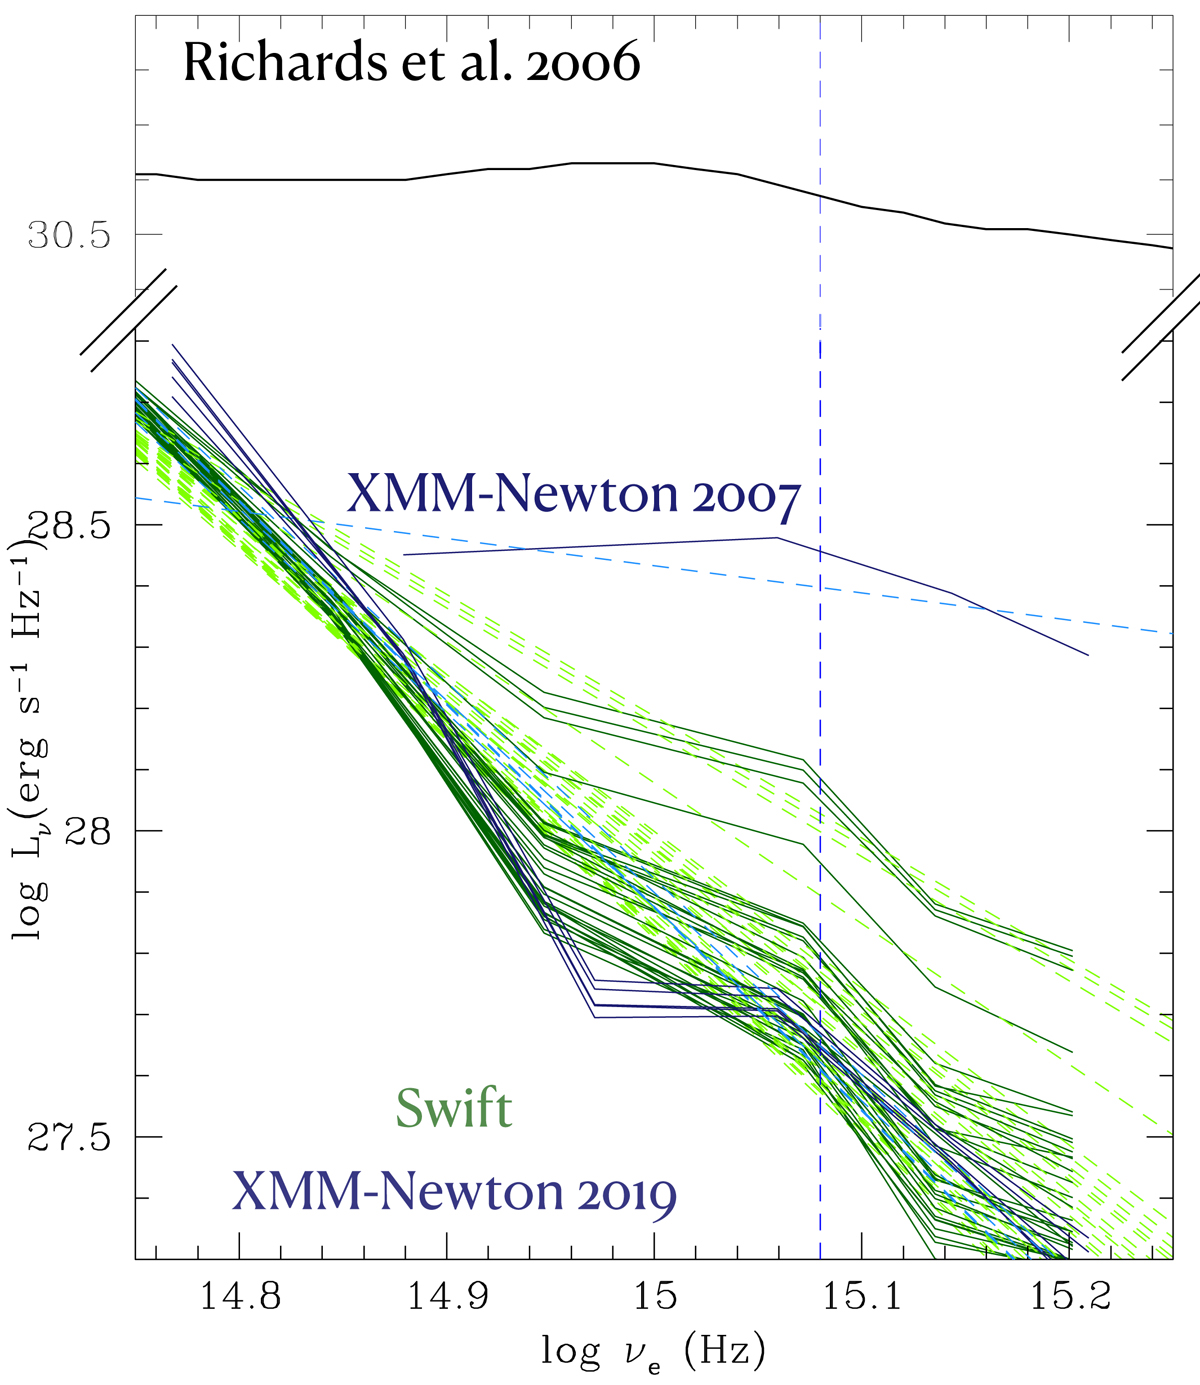
Download original image
ESO 511-G030 optical-UV SEDs derived using XMM-Newton and Swift data (dark green). The corresponding least squares fits are shown as straight dashed lines. XMM-Newton and Swift data are in blue and dark green, respectively. The solid, thick black line is the average SED by Richards et al. (2006) for Type 1 objects in the SDSS. The vertical dashed line is at logν* = 15.08, corresponding to 2500 Å. We noticed a remarkable change in spectral shape from the 2007 observation compared to the later ones.
Current usage metrics show cumulative count of Article Views (full-text article views including HTML views, PDF and ePub downloads, according to the available data) and Abstracts Views on Vision4Press platform.
Data correspond to usage on the plateform after 2015. The current usage metrics is available 48-96 hours after online publication and is updated daily on week days.
Initial download of the metrics may take a while.