Fig. 2.
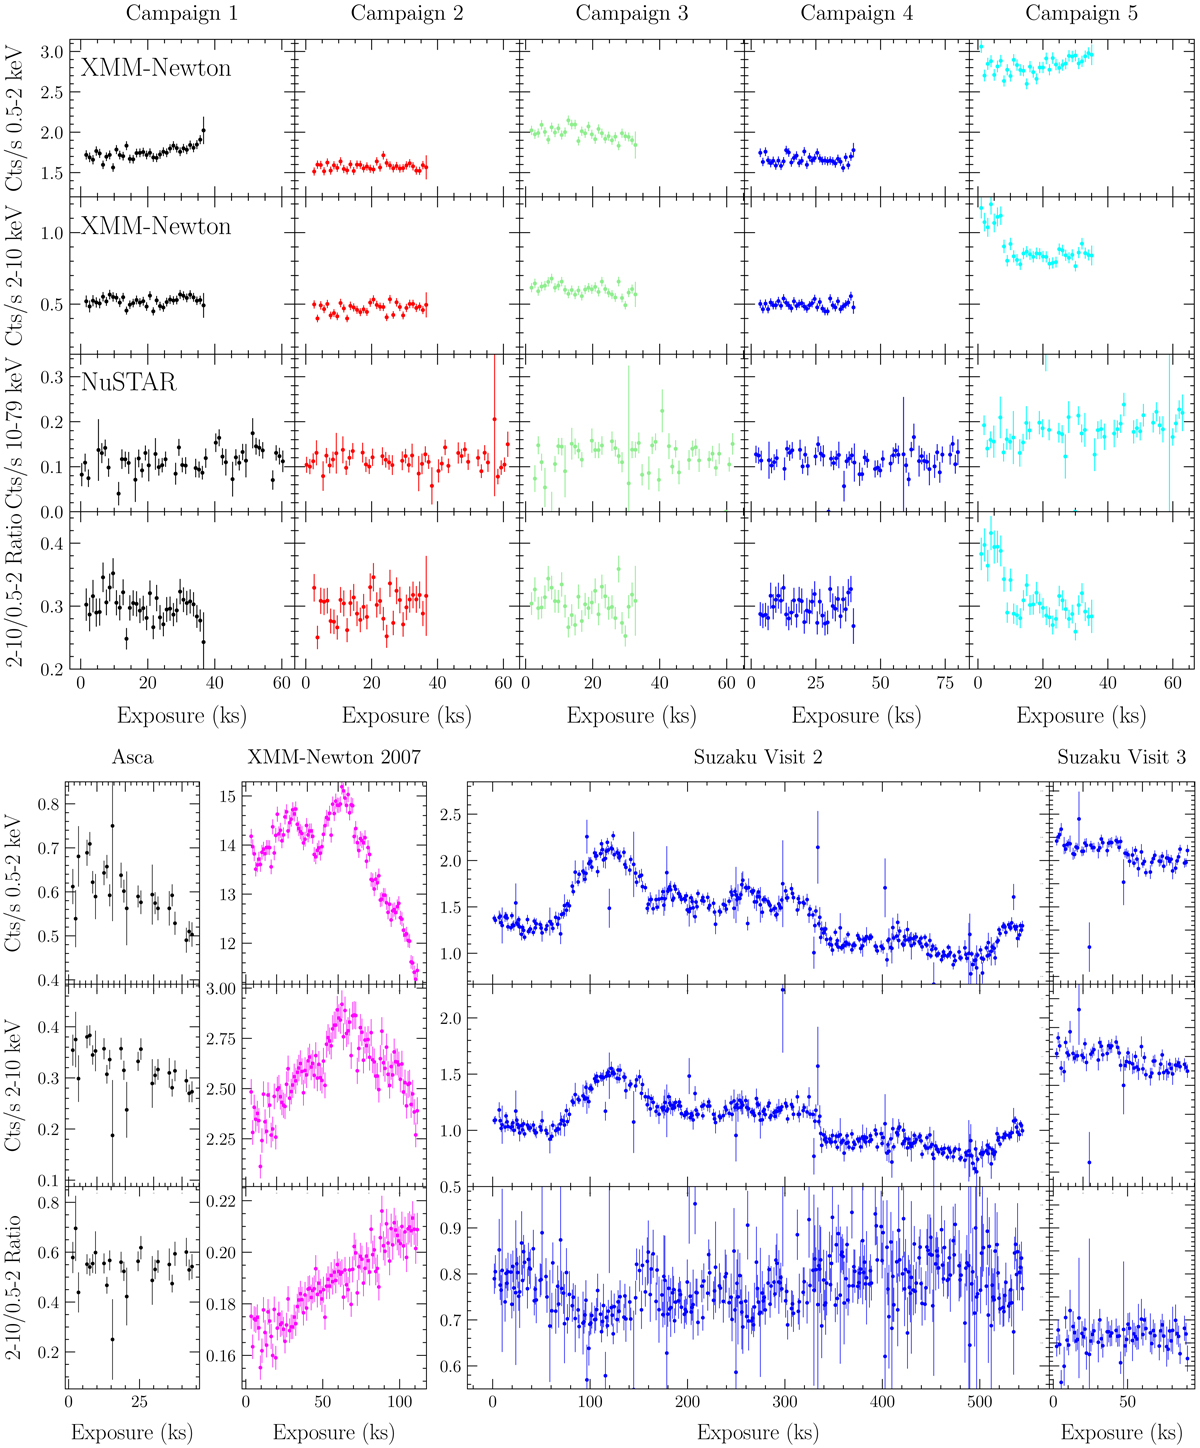
Download original image
ESO511-G030 light curves. Top panels: Background-subtracted light curves from the 2019 multi-wavelength campaign. The first and second row refer to the XMM-Newton 0.5–2 and 2–10 keV bands, respectively, while the last row shows the ratios between the two bands. The NuSTAR light curves extracted in the 10–79 keV band are also shown. Bottom panels: Background-subtracted time series for ASCA (black), the 2007 XMM-Newton orbit (red) and the Suzaku visits two and three (in blue).
Current usage metrics show cumulative count of Article Views (full-text article views including HTML views, PDF and ePub downloads, according to the available data) and Abstracts Views on Vision4Press platform.
Data correspond to usage on the plateform after 2015. The current usage metrics is available 48-96 hours after online publication and is updated daily on week days.
Initial download of the metrics may take a while.