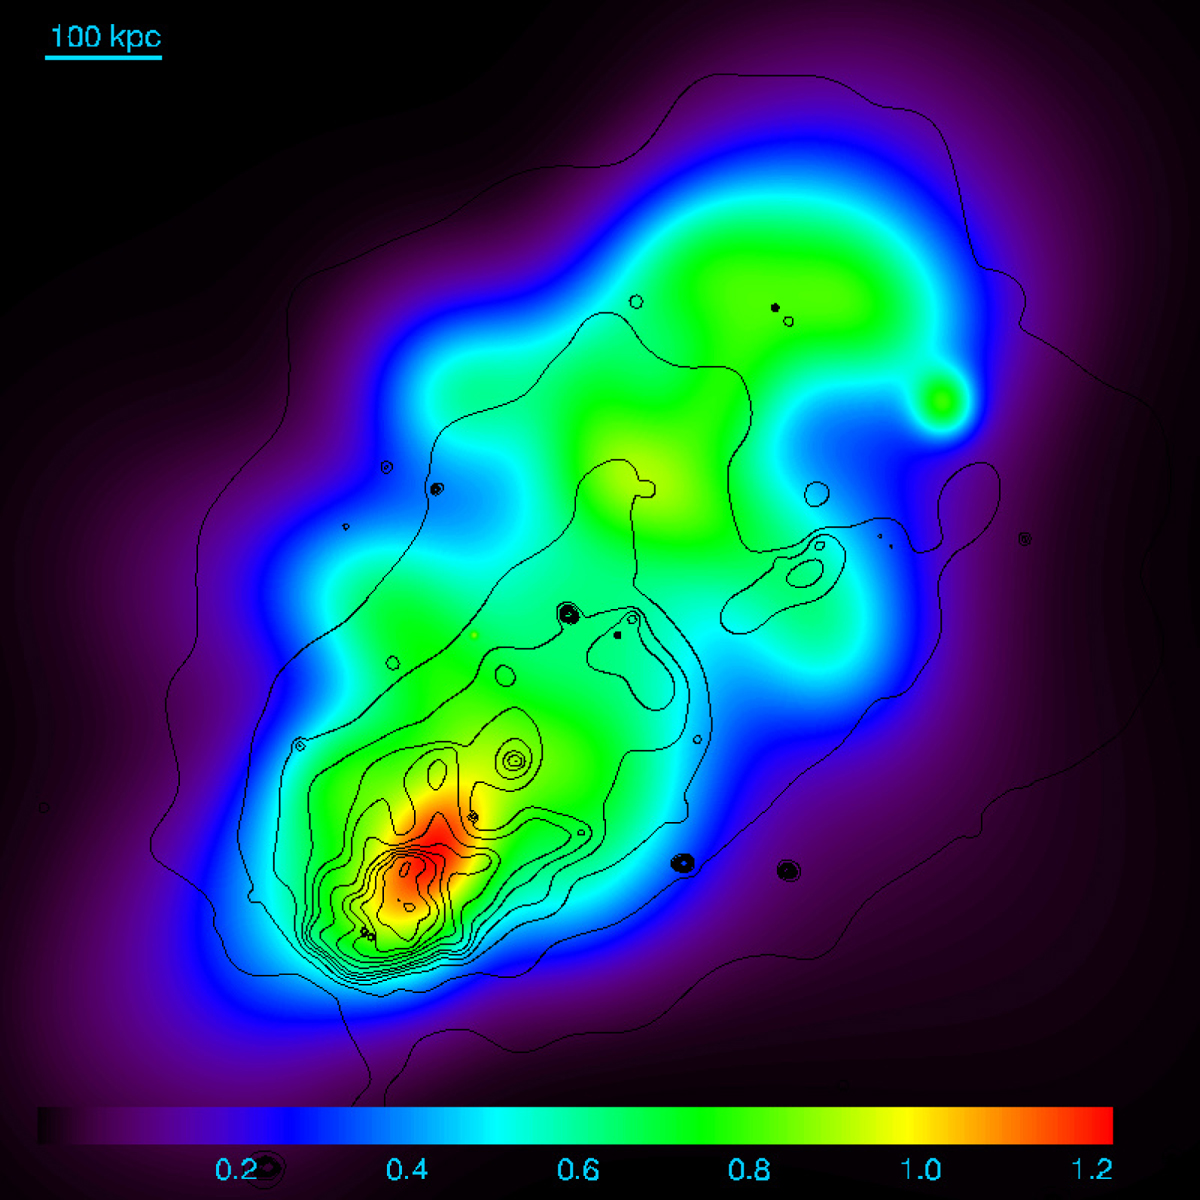
Fig. 14.
Download original image
Mass vs. X-ray for the model Full-a. The color plot shows the convergence (at z = 3) for the spectroscopic model. Only the dark matter component of the lens model is shown. X-ray emission from Chandra are shown as black contours. It is important to note the excess of mass near the X-ray local peak at the east. The south clump is now clearly more massive than the northern one but also more elongated along the direction of motion.
Current usage metrics show cumulative count of Article Views (full-text article views including HTML views, PDF and ePub downloads, according to the available data) and Abstracts Views on Vision4Press platform.
Data correspond to usage on the plateform after 2015. The current usage metrics is available 48-96 hours after online publication and is updated daily on week days.
Initial download of the metrics may take a while.