Fig. 16.
Download original image
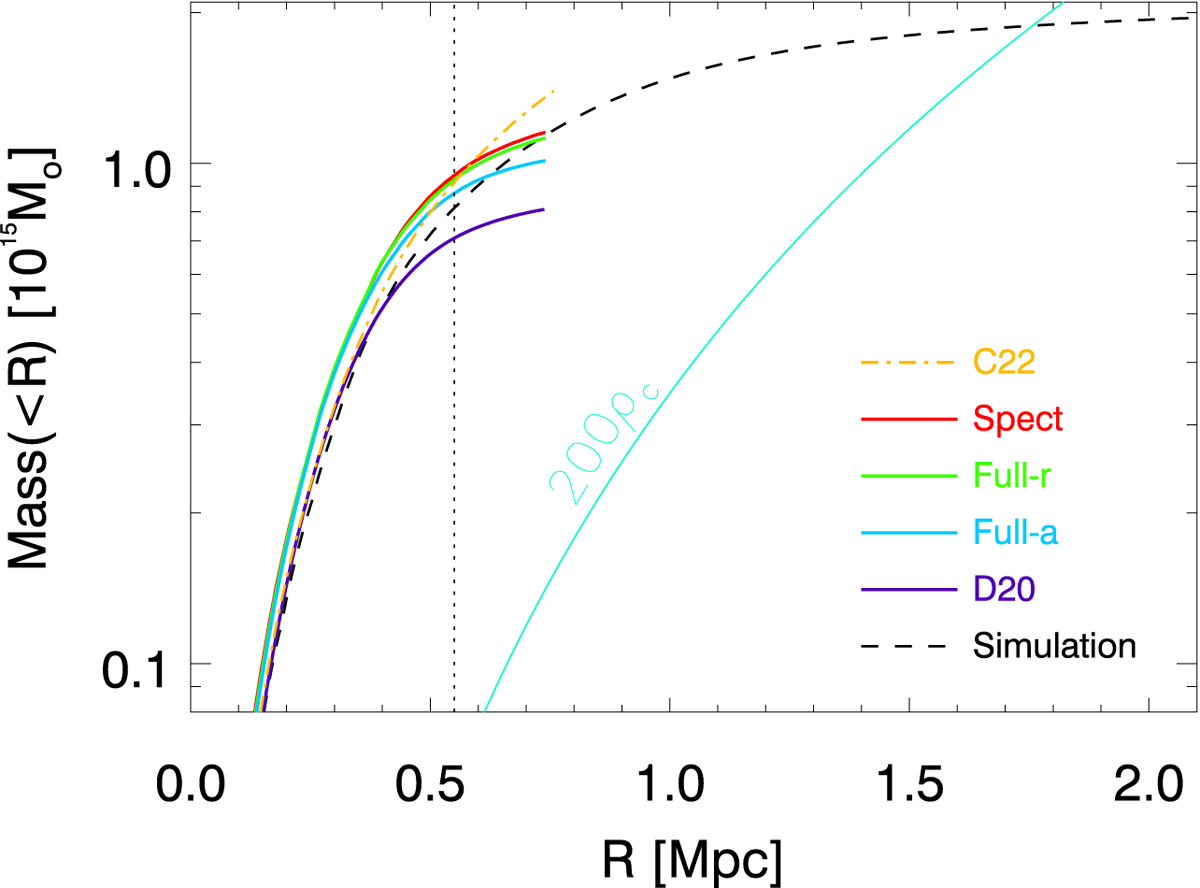
Total El Gordo mass as a function of radius. The red curve shows values for the spectroscopic model, the green curve for the Full-r model, and the cyan curve for the Full-a model. The purple line shows the mass obtained derived from the RELICS data using the same algorithm but different constraints (Diego et al. 2020). The orange dot-dashed line shows the recent model of Caminha et al. (2022). The black dashed line shows values from a simulation (Molnar & Broadhurst 2015). All mass curves are based on a common center, and the masses are cylindrical, that is, they correspond to the mass within a cylinder of radius R projected along the line of sight. The light turquoise line shows the mass enclosed in a sphere with constant density equal to 200 times the critical density. While the spherical mass is not identical to the cylinder mass, for an NFW with concentration c = 7, the 3D mass computed up to the virial radius is only ≈4% smaller than the 2D mass. The vertical dotted line marks the maximum radius (70″) at which lensing constraints exist. The integrated masses will be biased low beyond this point.
Current usage metrics show cumulative count of Article Views (full-text article views including HTML views, PDF and ePub downloads, according to the available data) and Abstracts Views on Vision4Press platform.
Data correspond to usage on the plateform after 2015. The current usage metrics is available 48-96 hours after online publication and is updated daily on week days.
Initial download of the metrics may take a while.