Fig. 17.
Download original image
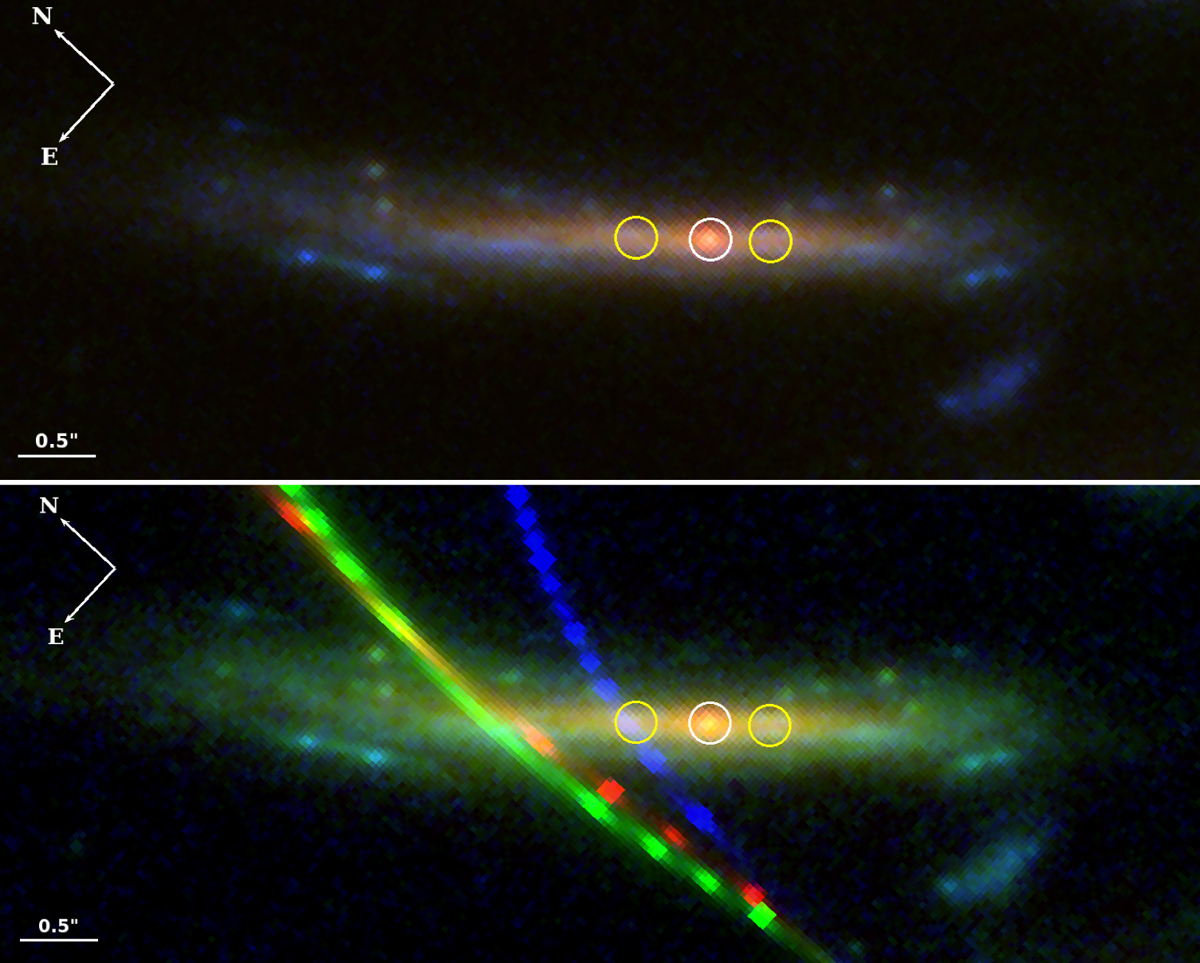
Possible caustic crossing event in system 23 at z = 2.1878. Top: Color image combining F115W, F200W, and F356W as blue, green, and red, respectively. The outer, yellow circles mark the positions of 23.4a and 23.4b, two counterimages of a source that brackets the position of the critical curve. The white, central circle marks a bright source (called “Quyllur”) that lies approximately at the midpoint. Bottom: color image with the RGB6 combination. Red, green, and blue curves show the critical curves for the spectroscopic, Full-r, and Full-a models respectively. The two panels have the same scale and orientation as indicated at the left.
Current usage metrics show cumulative count of Article Views (full-text article views including HTML views, PDF and ePub downloads, according to the available data) and Abstracts Views on Vision4Press platform.
Data correspond to usage on the plateform after 2015. The current usage metrics is available 48-96 hours after online publication and is updated daily on week days.
Initial download of the metrics may take a while.