Open Access
Fig. 18.
Download original image
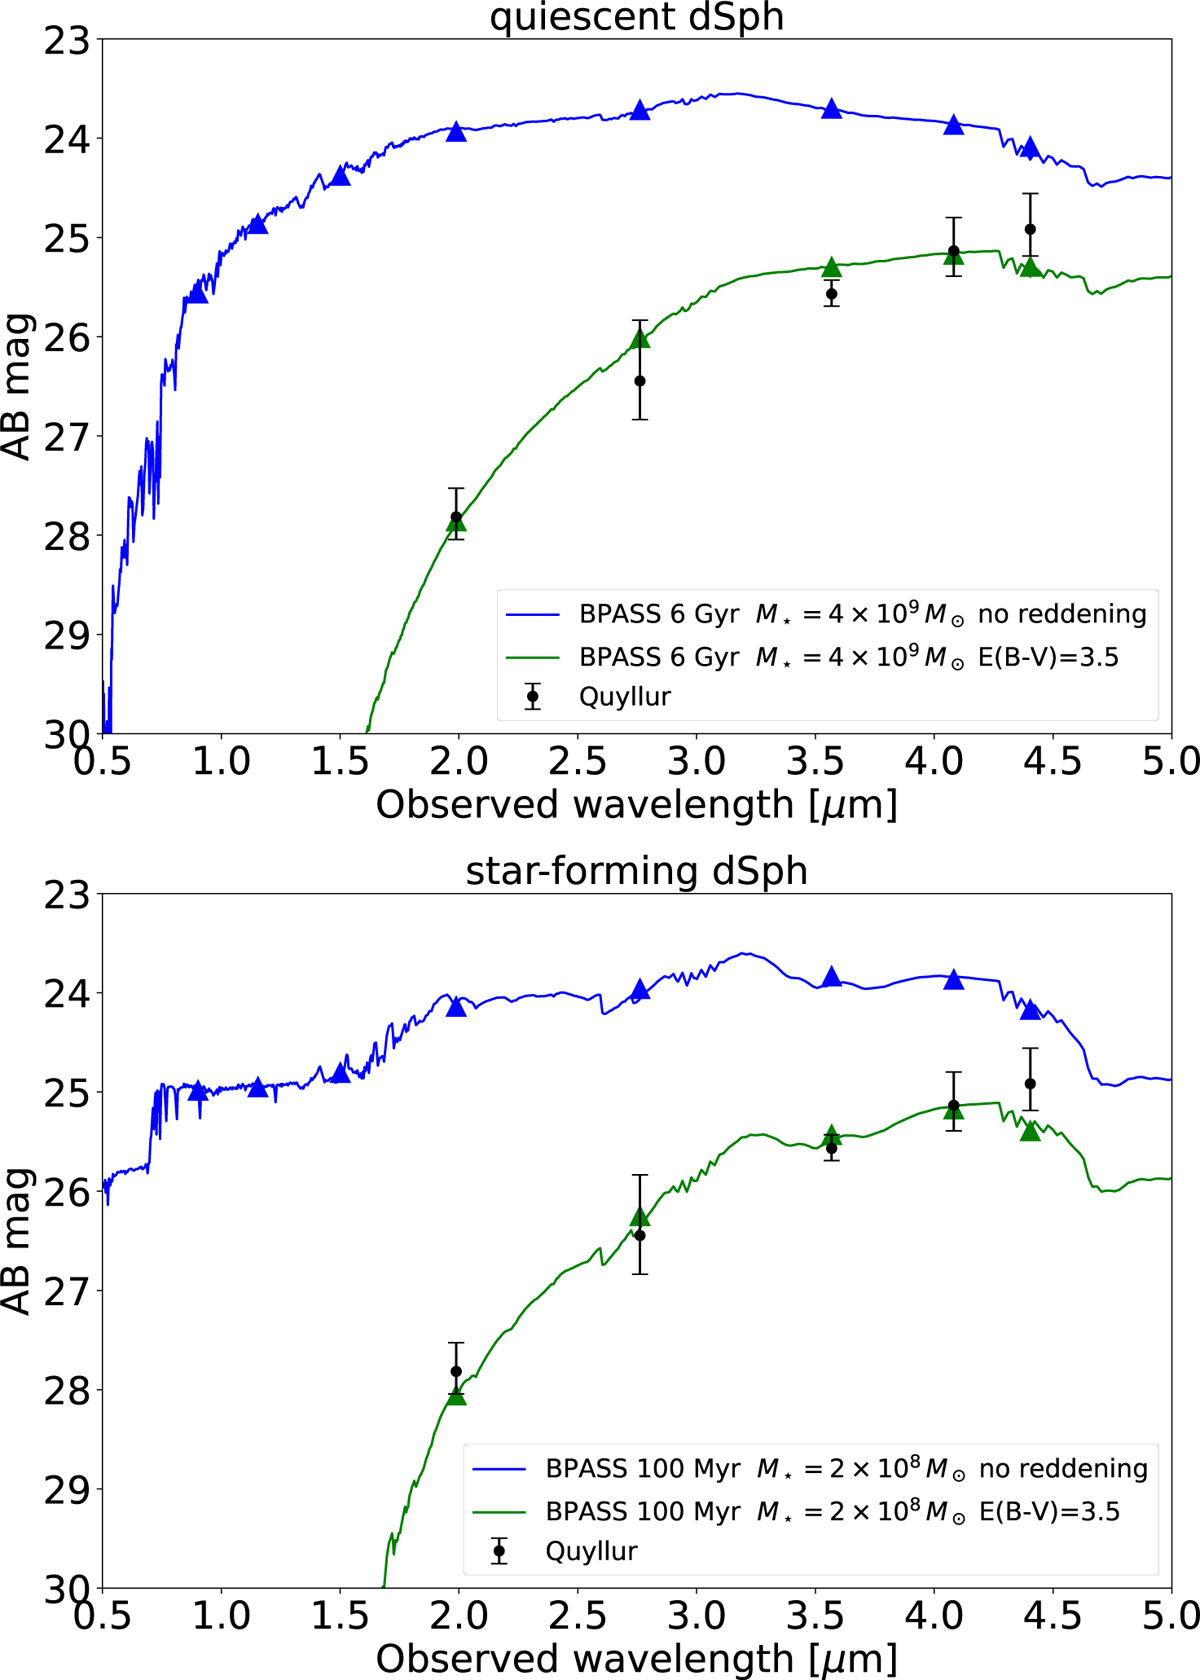
Quyllur compared to SEDs of single stellar populations at El Gordo’s redshift z = 0.87. Blue lines show the unreddened models as labeled, and green lines show the models reddened with E(B − V) = 3.5 mag. Black points with error bars show the Quyllur photometry. For a comparison with the SED of individual stars see Fig. 21.
Current usage metrics show cumulative count of Article Views (full-text article views including HTML views, PDF and ePub downloads, according to the available data) and Abstracts Views on Vision4Press platform.
Data correspond to usage on the plateform after 2015. The current usage metrics is available 48-96 hours after online publication and is updated daily on week days.
Initial download of the metrics may take a while.