Fig. 19.
Download original image
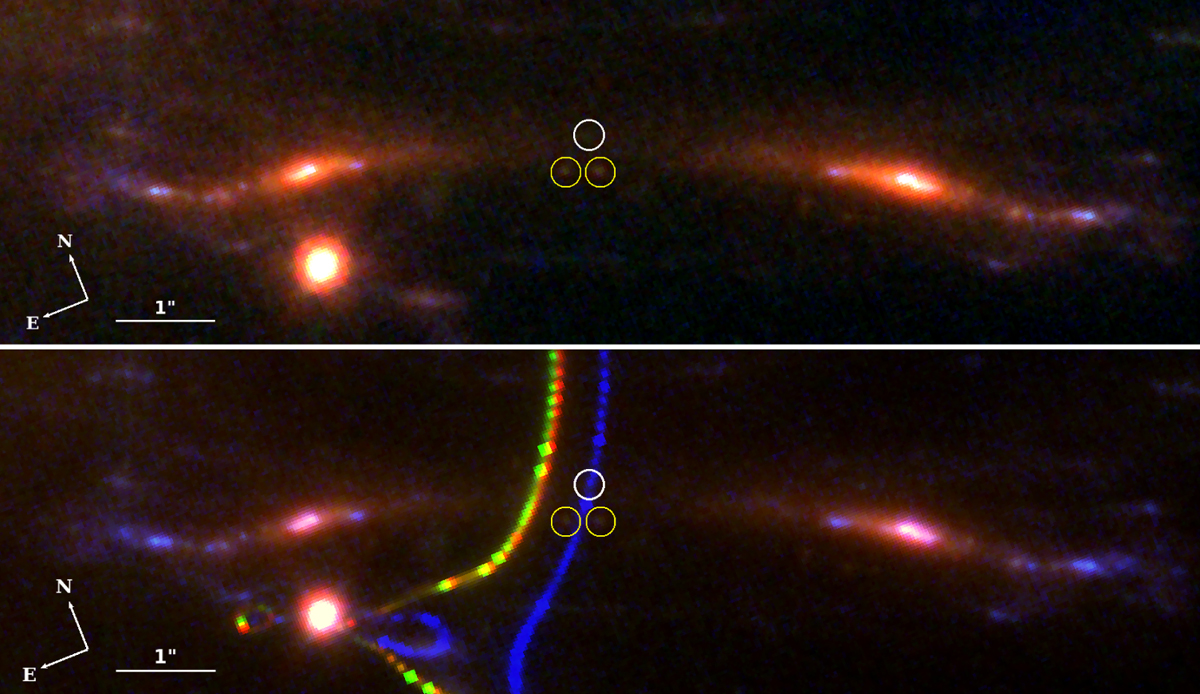
Possible caustic crossing in system 1. Top: Color image combining F090W, F200W, and F356W as blue, green, and red, respectively. Bottom: Color image in the RGB6 pallette with critical curves from the spectroscopic, Full-r, and Full-a models shown as red, green, and blue, respectively. In both images, the two yellow circles mark images 1.3a and 1.3b, a pair of counterimages close to the expected position of the critical curve. The white circle contains a faint source that is barely resolved.
Current usage metrics show cumulative count of Article Views (full-text article views including HTML views, PDF and ePub downloads, according to the available data) and Abstracts Views on Vision4Press platform.
Data correspond to usage on the plateform after 2015. The current usage metrics is available 48-96 hours after online publication and is updated daily on week days.
Initial download of the metrics may take a while.