Fig. 5.
Download original image
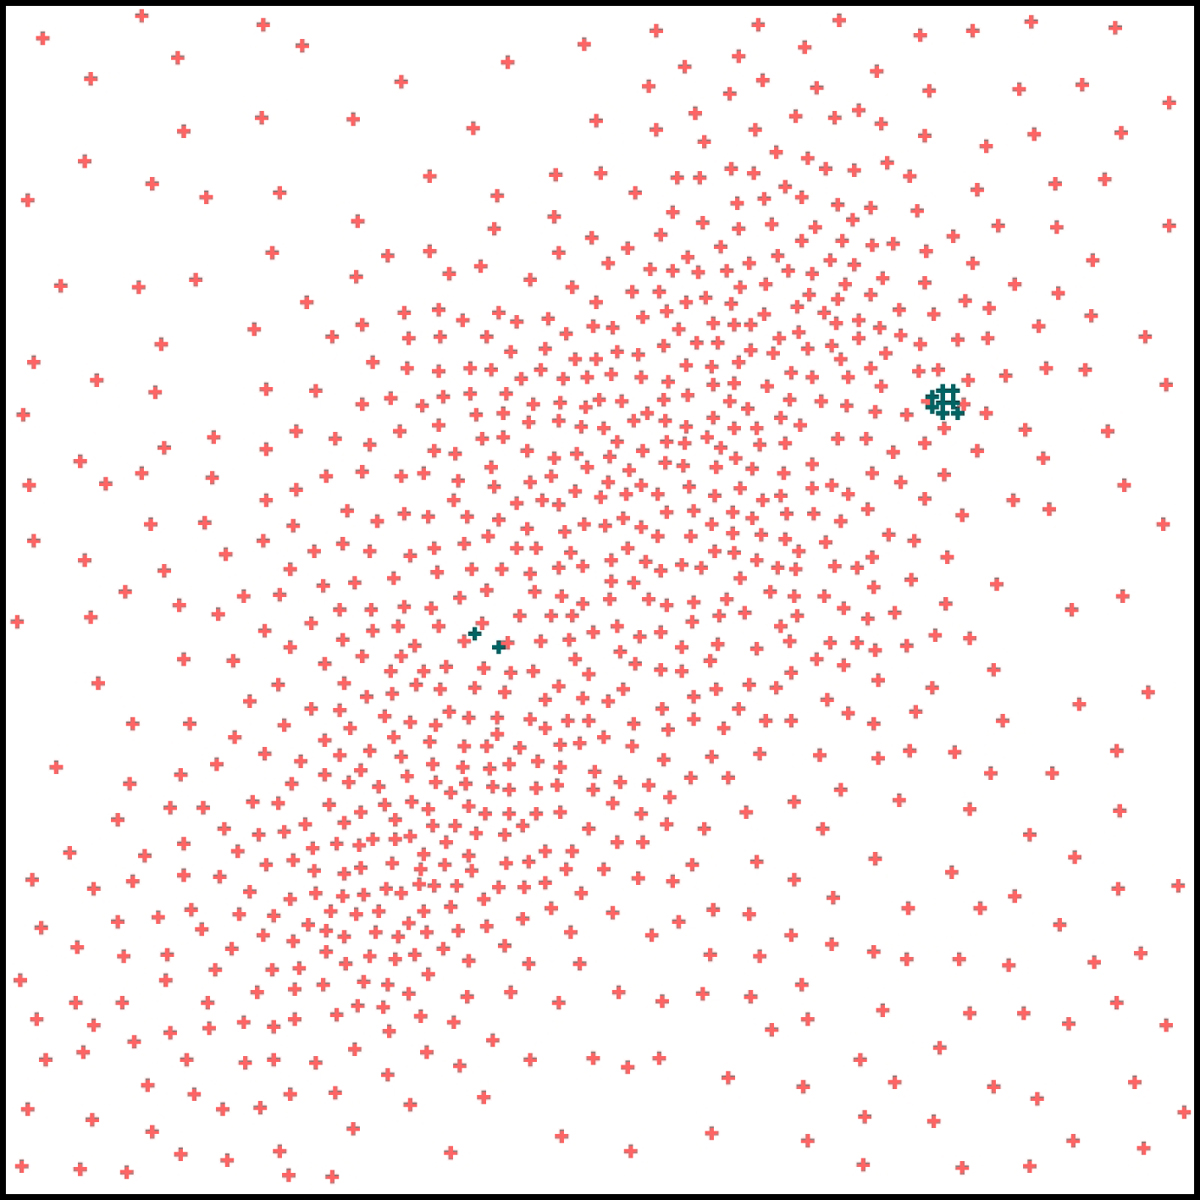
Multiresolution adaptive grid. The number density of grid points (shown as 891 red crosses) traces a smooth version of the solution in the spectroscopic lens model, increasing the resolution in the densest regions. Ten additional grid points are shown as small black crosses. Two of them mark the perturbers in the La Flaca arc with scales of 0![]() 12 and 0
12 and 0![]() 24, and eight more are in the inner region of the Anzuelo arc. Each one of these 8 grid points has a scale of 1
24, and eight more are in the inner region of the Anzuelo arc. Each one of these 8 grid points has a scale of 1![]() 8.
8.
Current usage metrics show cumulative count of Article Views (full-text article views including HTML views, PDF and ePub downloads, according to the available data) and Abstracts Views on Vision4Press platform.
Data correspond to usage on the plateform after 2015. The current usage metrics is available 48-96 hours after online publication and is updated daily on week days.
Initial download of the metrics may take a while.