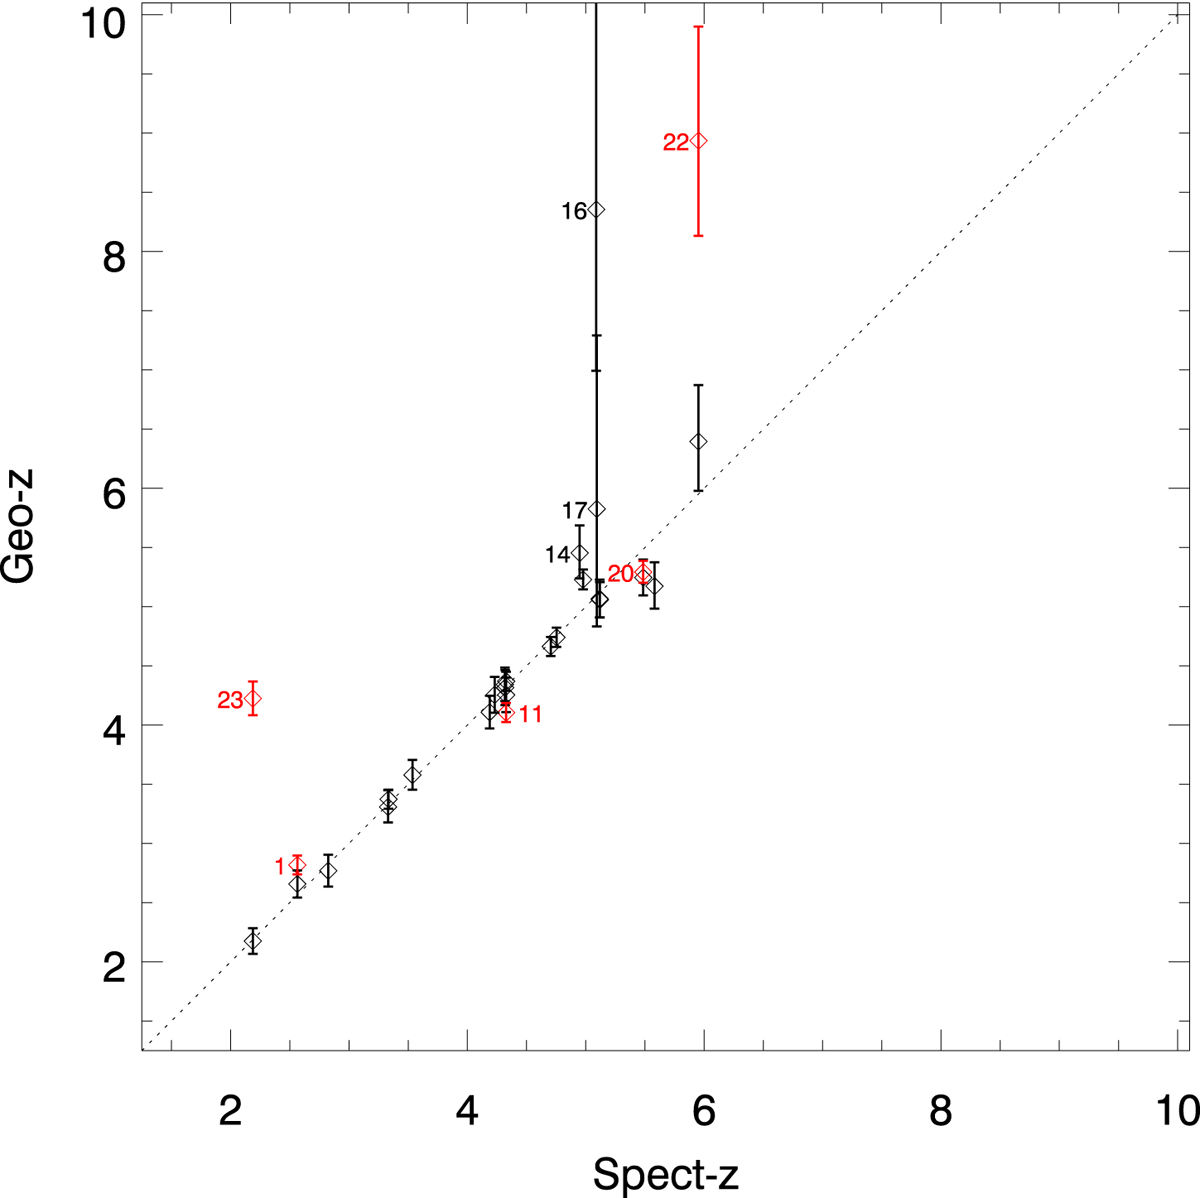
Fig. 8.
Download original image
Geometric redshifts compared with the input spectroscopic redshifts. This plot shows a sanity test where the input redshifts are properly recovered by the lens model. Families with discrepant redshifts are labeled. Black points show results of the spectroscopic model, and red points show results of a bootstrap analysis where a new model was derived without that particular system and that model used to predict the system’s redshift.
Current usage metrics show cumulative count of Article Views (full-text article views including HTML views, PDF and ePub downloads, according to the available data) and Abstracts Views on Vision4Press platform.
Data correspond to usage on the plateform after 2015. The current usage metrics is available 48-96 hours after online publication and is updated daily on week days.
Initial download of the metrics may take a while.