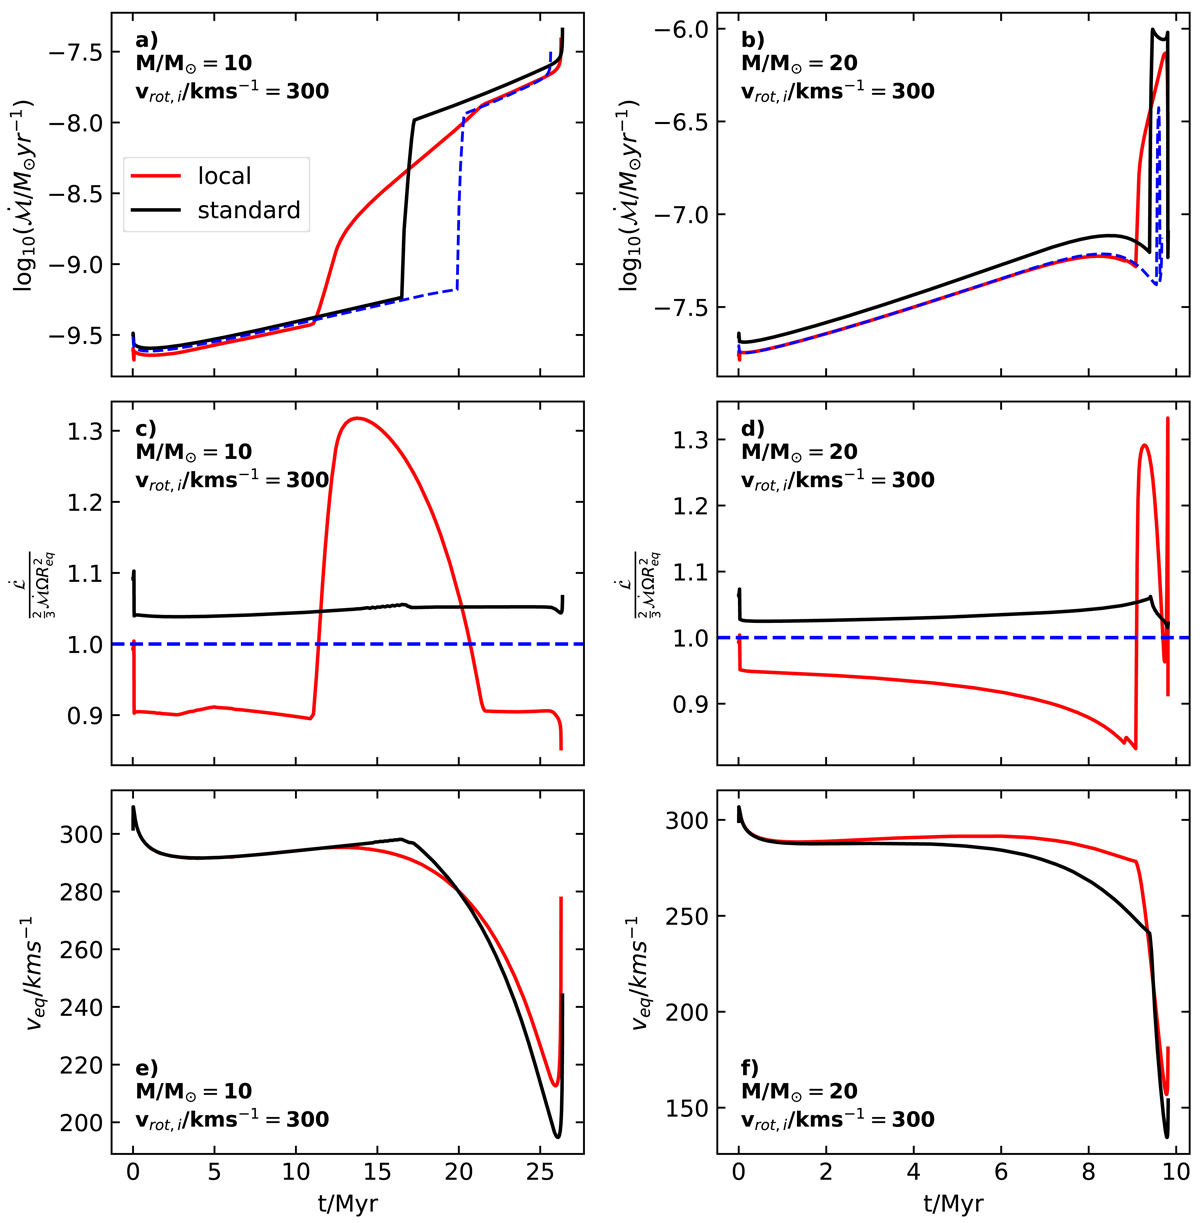
Fig. 3.
Download original image
Upper panels: evolution of global mass-loss rate as a function of time. The blue dashed line shows the mass-loss rate computed from a non-rotating model. Central panels: evolution of normalised specific angular momentum loss, as given by Eq. (19) (see text for details). In the limit of slow rotation this quantity is equal to unity, shown by the blue dashed line. Lower panels: evolution of the equatorial rotational velocity as a function of time. The left panels show a 10 M⊙ model, the right panels a 20 M⊙ model. Predictions of the local scheme, where surface mass flux is determined by Eq. (16) and the global mass-loss rate given by Eq. (11), are given in red. The standard scheme, where the mass loss rates are increased by Eq. (17) is depicted in black. All rotating models have initial equatorial rotational velocities of 300 km s−1.
Current usage metrics show cumulative count of Article Views (full-text article views including HTML views, PDF and ePub downloads, according to the available data) and Abstracts Views on Vision4Press platform.
Data correspond to usage on the plateform after 2015. The current usage metrics is available 48-96 hours after online publication and is updated daily on week days.
Initial download of the metrics may take a while.