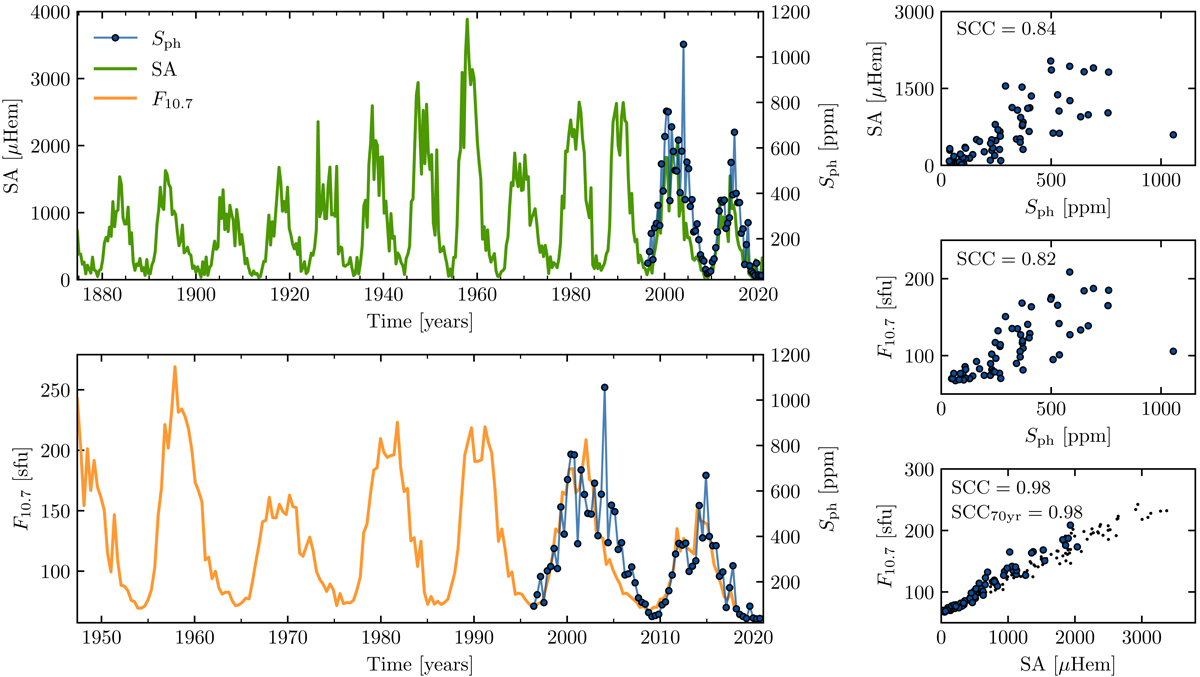
Fig. A.4.
Download original image
Comparison between the solar magnetic APs. In the left panels, Sph from VIRGO g+r is shown by the blue circles, while SA and F10.7 are shown by the solid green and orange lines, respectively. The right-hand side shows how F10.7, SA, and Sph relate to each other: the blue circles correspond to solar cycles 23 and 24, the black dots correspond to the ∼70 years of contemporaneous observations of SA and F10.7. Each panel shows the corresponding SCC value, where “70yr” stands for 70 years of common SA and F10.7 observations.
Current usage metrics show cumulative count of Article Views (full-text article views including HTML views, PDF and ePub downloads, according to the available data) and Abstracts Views on Vision4Press platform.
Data correspond to usage on the plateform after 2015. The current usage metrics is available 48-96 hours after online publication and is updated daily on week days.
Initial download of the metrics may take a while.