Fig. 9.
Download original image
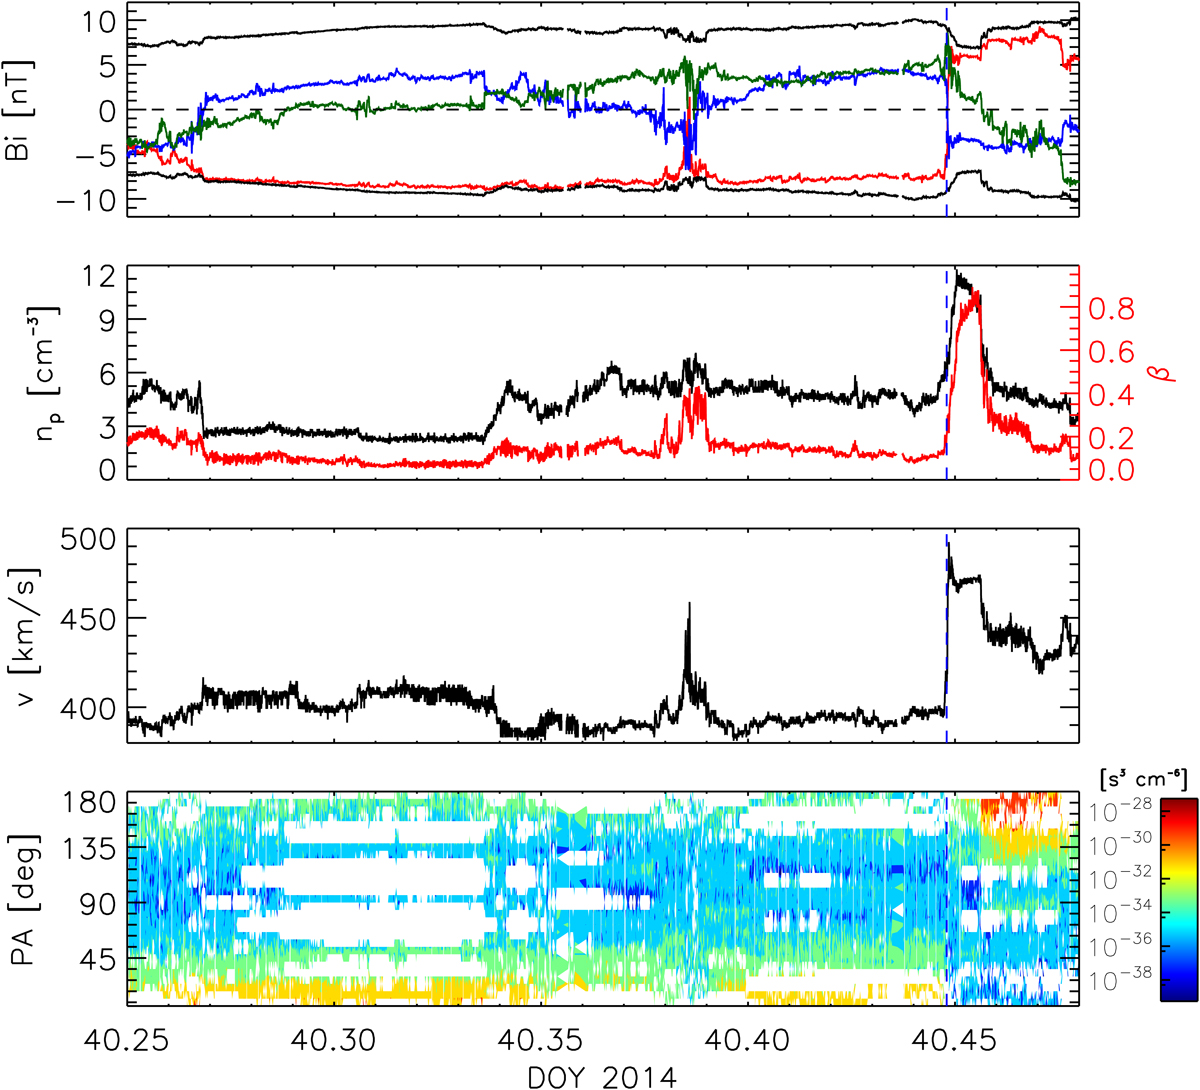
Selected plasma and magnetic field measurements for the back region of the ICME disturbance. The first panel shows the GSE-components of the magnetic field with same color-coding as in Fig. 8, and the absolute value of the magnetic field strength is plotted in black, with negative and positive sign. Again, the horizontal dashed line marks 0 nT. The second panel displays the proton density (black) and the plasma β (red). The third panel shows the proton speed. The fourth panel shows the PAD. Like in Fig. 8, the dashed blue line indicates the onset of the slow-mode wave. The magnetic field behaves similarly as in MCs.
Current usage metrics show cumulative count of Article Views (full-text article views including HTML views, PDF and ePub downloads, according to the available data) and Abstracts Views on Vision4Press platform.
Data correspond to usage on the plateform after 2015. The current usage metrics is available 48-96 hours after online publication and is updated daily on week days.
Initial download of the metrics may take a while.