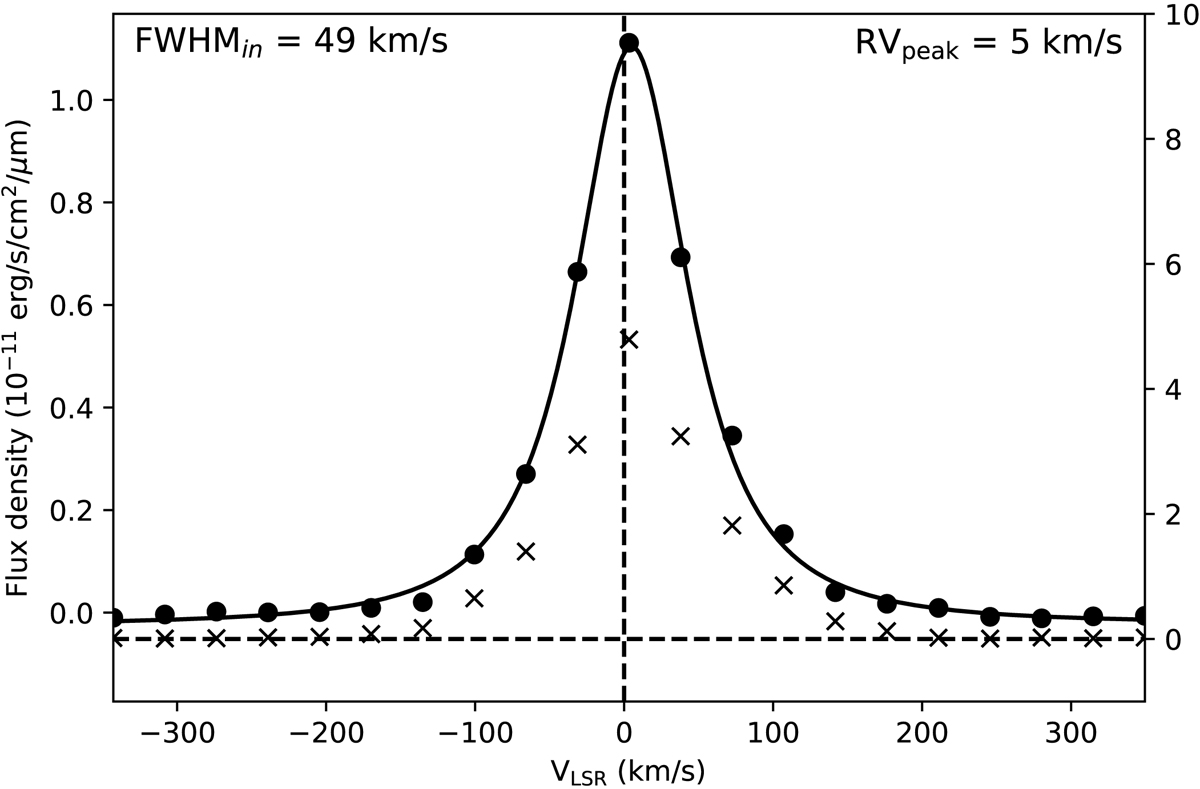
Fig. 9.
Download original image
Fit of the line profile of the H2 2.122 μm line (FWHMin = 49 ± 11 km s−1) integrated over the central region using a Moffat function (solid black line). The peak of the emission profile is redshifted by ∼5 ± 2.7 km s−1 with respect to the system velocity of ∼3 km s−1 (dashed vertical line). The S/N computed for each position is indicated with a cross. The S/N scale is shown on the right y-axis, and the dashed horizontal line indicates the zero level.
Current usage metrics show cumulative count of Article Views (full-text article views including HTML views, PDF and ePub downloads, according to the available data) and Abstracts Views on Vision4Press platform.
Data correspond to usage on the plateform after 2015. The current usage metrics is available 48-96 hours after online publication and is updated daily on week days.
Initial download of the metrics may take a while.