Fig. 11.
Download original image
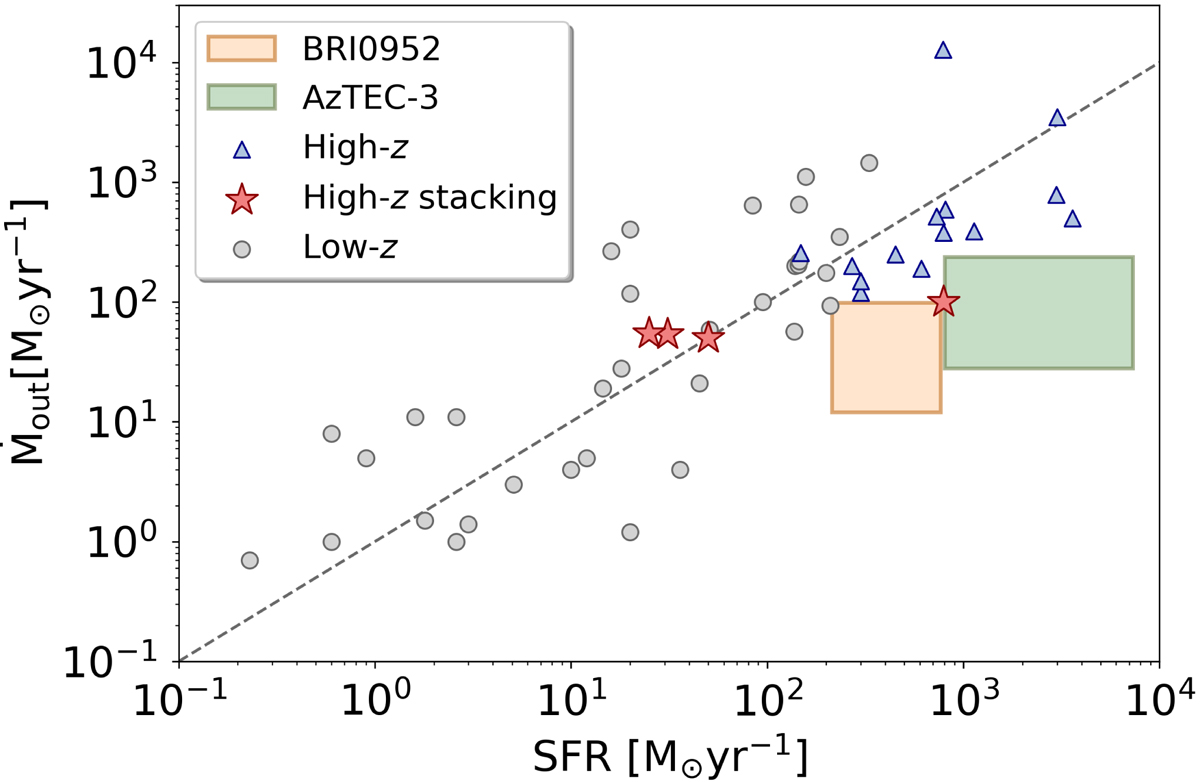
Mass outflow rate versus SFR for our objects and low- and high-redshift galaxies, including stacking approaches at high redshift. The green and orange rectangles represent the range of possible values for AzTEC-3 and BRI0952, respectively. The low-z comparison sample is taken from Fluetsch et al. (2019), high-redshift direct observations are taken from Maiolino et al. (2012), George et al. (2014), Feruglio et al. (2017), Brusa et al. (2018), Herrera-Camus et al. (2019), Jones et al. (2019), Spilker et al. (2020), Butler et al. (2021), and high-redshift stacking averages are taken from Gallerani et al. (2018), Bischetti et al. (2019), Ginolfi et al. (2020). For Ginolfi et al. (2020), we plot the high-SFR sample and the median-SFR sample in their stacking methodology as separate points. We utilized an average of the mass outflow rates if a range is provided for an object.
Current usage metrics show cumulative count of Article Views (full-text article views including HTML views, PDF and ePub downloads, according to the available data) and Abstracts Views on Vision4Press platform.
Data correspond to usage on the plateform after 2015. The current usage metrics is available 48-96 hours after online publication and is updated daily on week days.
Initial download of the metrics may take a while.