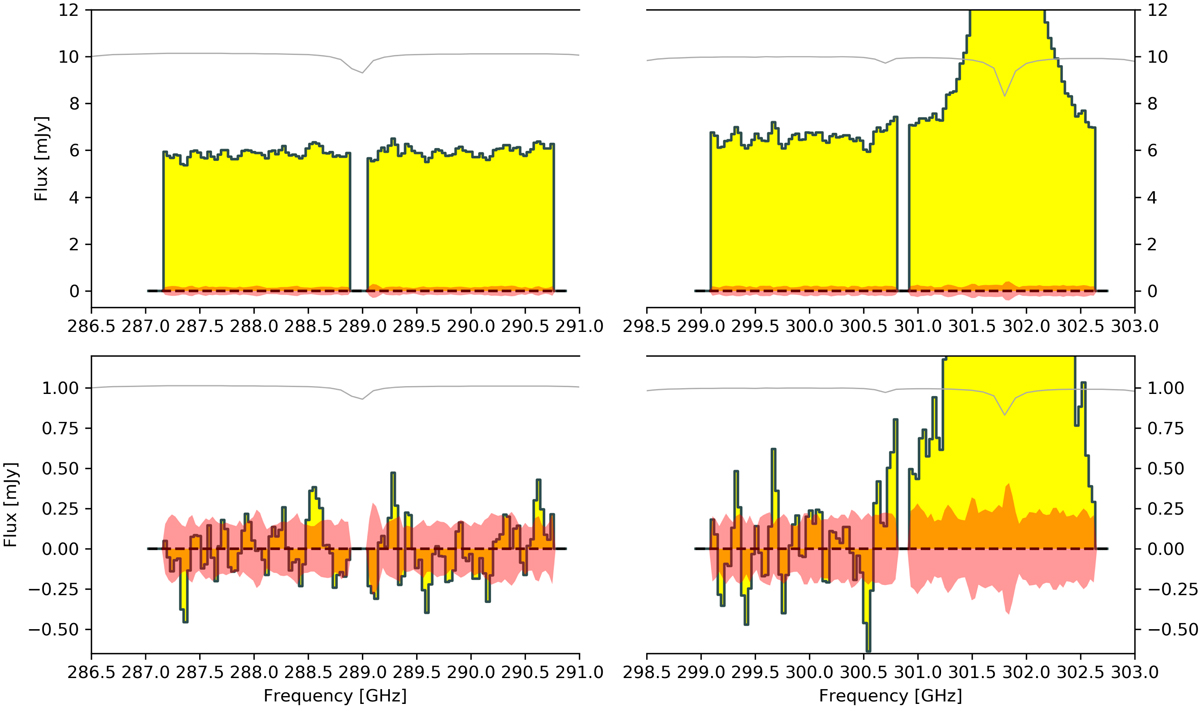
Fig. A.1.
Download original image
Pre-continuum-subtracted (top) and post-continuum-subtracted (bottom) spectra of AzTEC-3 extracted from the same region as the spectra (black circle shown in panel 1 of Figure 7 using a fit on the order of 1 and encompassing frequencies up to 300 GHz. The red region represents the 1σ rms of the image and the gray line represents the atmospheric transmission at 1.0 mm PVW. The possible additional [C II] wing feature mentioned in Section 2 can be seen in the 300.5-301 GHz frequency range.
Current usage metrics show cumulative count of Article Views (full-text article views including HTML views, PDF and ePub downloads, according to the available data) and Abstracts Views on Vision4Press platform.
Data correspond to usage on the plateform after 2015. The current usage metrics is available 48-96 hours after online publication and is updated daily on week days.
Initial download of the metrics may take a while.