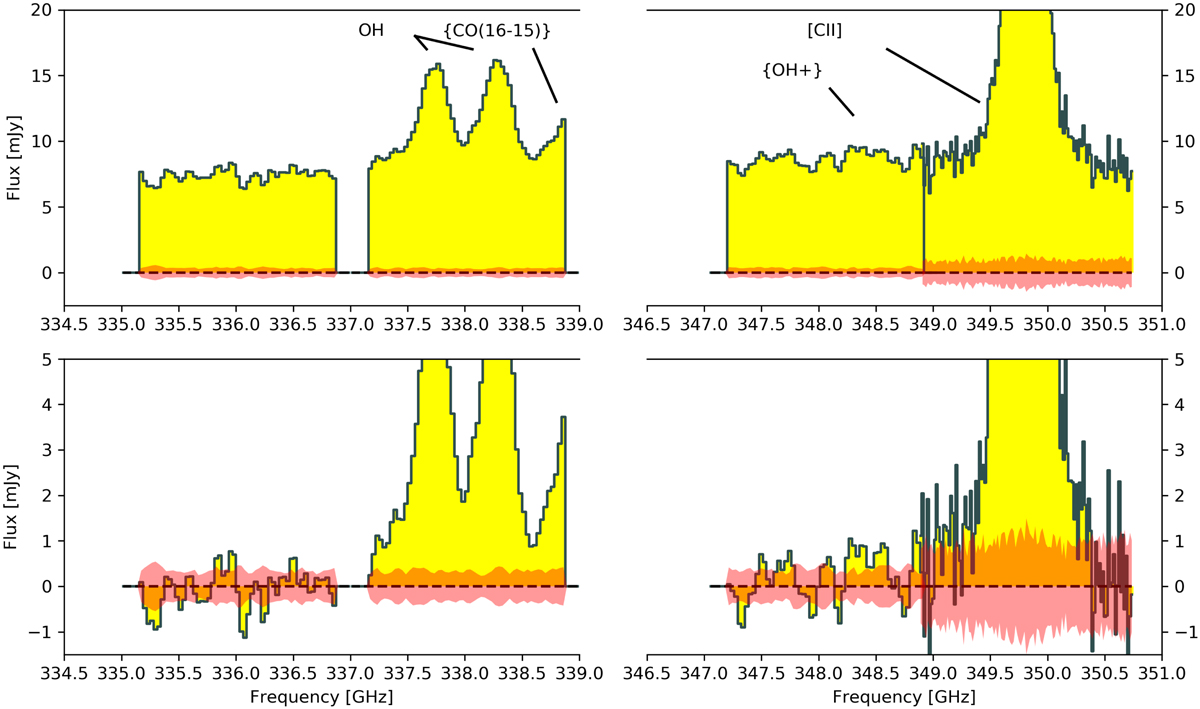
Fig. A.2.
Download original image
Pre-continuum-subtracted (top) and post-continuum-subtracted (bottom) spectra of BRI0952 extracted from the same region as the spectra (black circle shown in panel 1 of Figure 2 using a fit on the order of 1 and encompassing frequency ranges from ∼335.3 − 336.9, 347.1 − 347.7, 348.97 − 348.98, and 350.45 − 350.67 GHz. The red region represents the 1σ rms of the image. We do not show the atmospheric transmission as there are no relevant features in the frequency range. We note that the spectral window of the [C II] line has a higher spectral resolution (see Section 2), resulting in a higher noise level per channel compared to other spectral windows.
Current usage metrics show cumulative count of Article Views (full-text article views including HTML views, PDF and ePub downloads, according to the available data) and Abstracts Views on Vision4Press platform.
Data correspond to usage on the plateform after 2015. The current usage metrics is available 48-96 hours after online publication and is updated daily on week days.
Initial download of the metrics may take a while.