Open Access
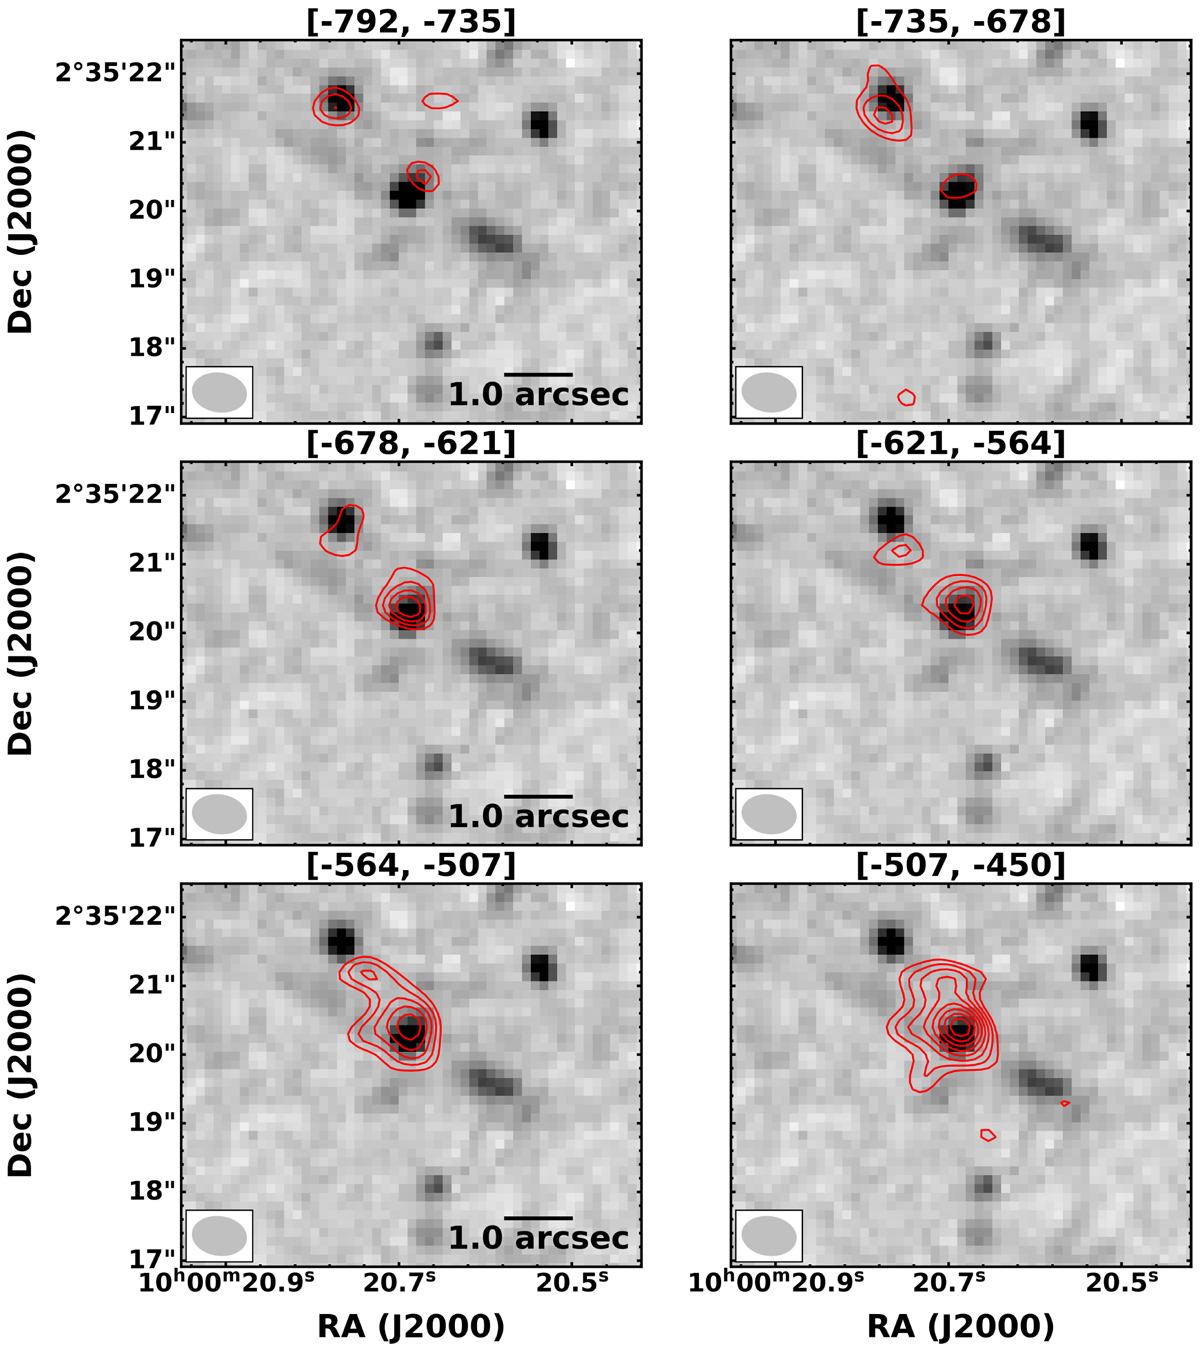
Fig. E.1.
Download original image
Velocity map of AzTEC-3 contours overlaid on HST F105W centered around the velocities at which the slight velocity gradient between LBG-3 and AzTEC-3 is visible. The velocity range is added to the top of the images. The red contours are at 3, 4, 5, 6, 7, 8, 9, and 10 σ levels.
Current usage metrics show cumulative count of Article Views (full-text article views including HTML views, PDF and ePub downloads, according to the available data) and Abstracts Views on Vision4Press platform.
Data correspond to usage on the plateform after 2015. The current usage metrics is available 48-96 hours after online publication and is updated daily on week days.
Initial download of the metrics may take a while.