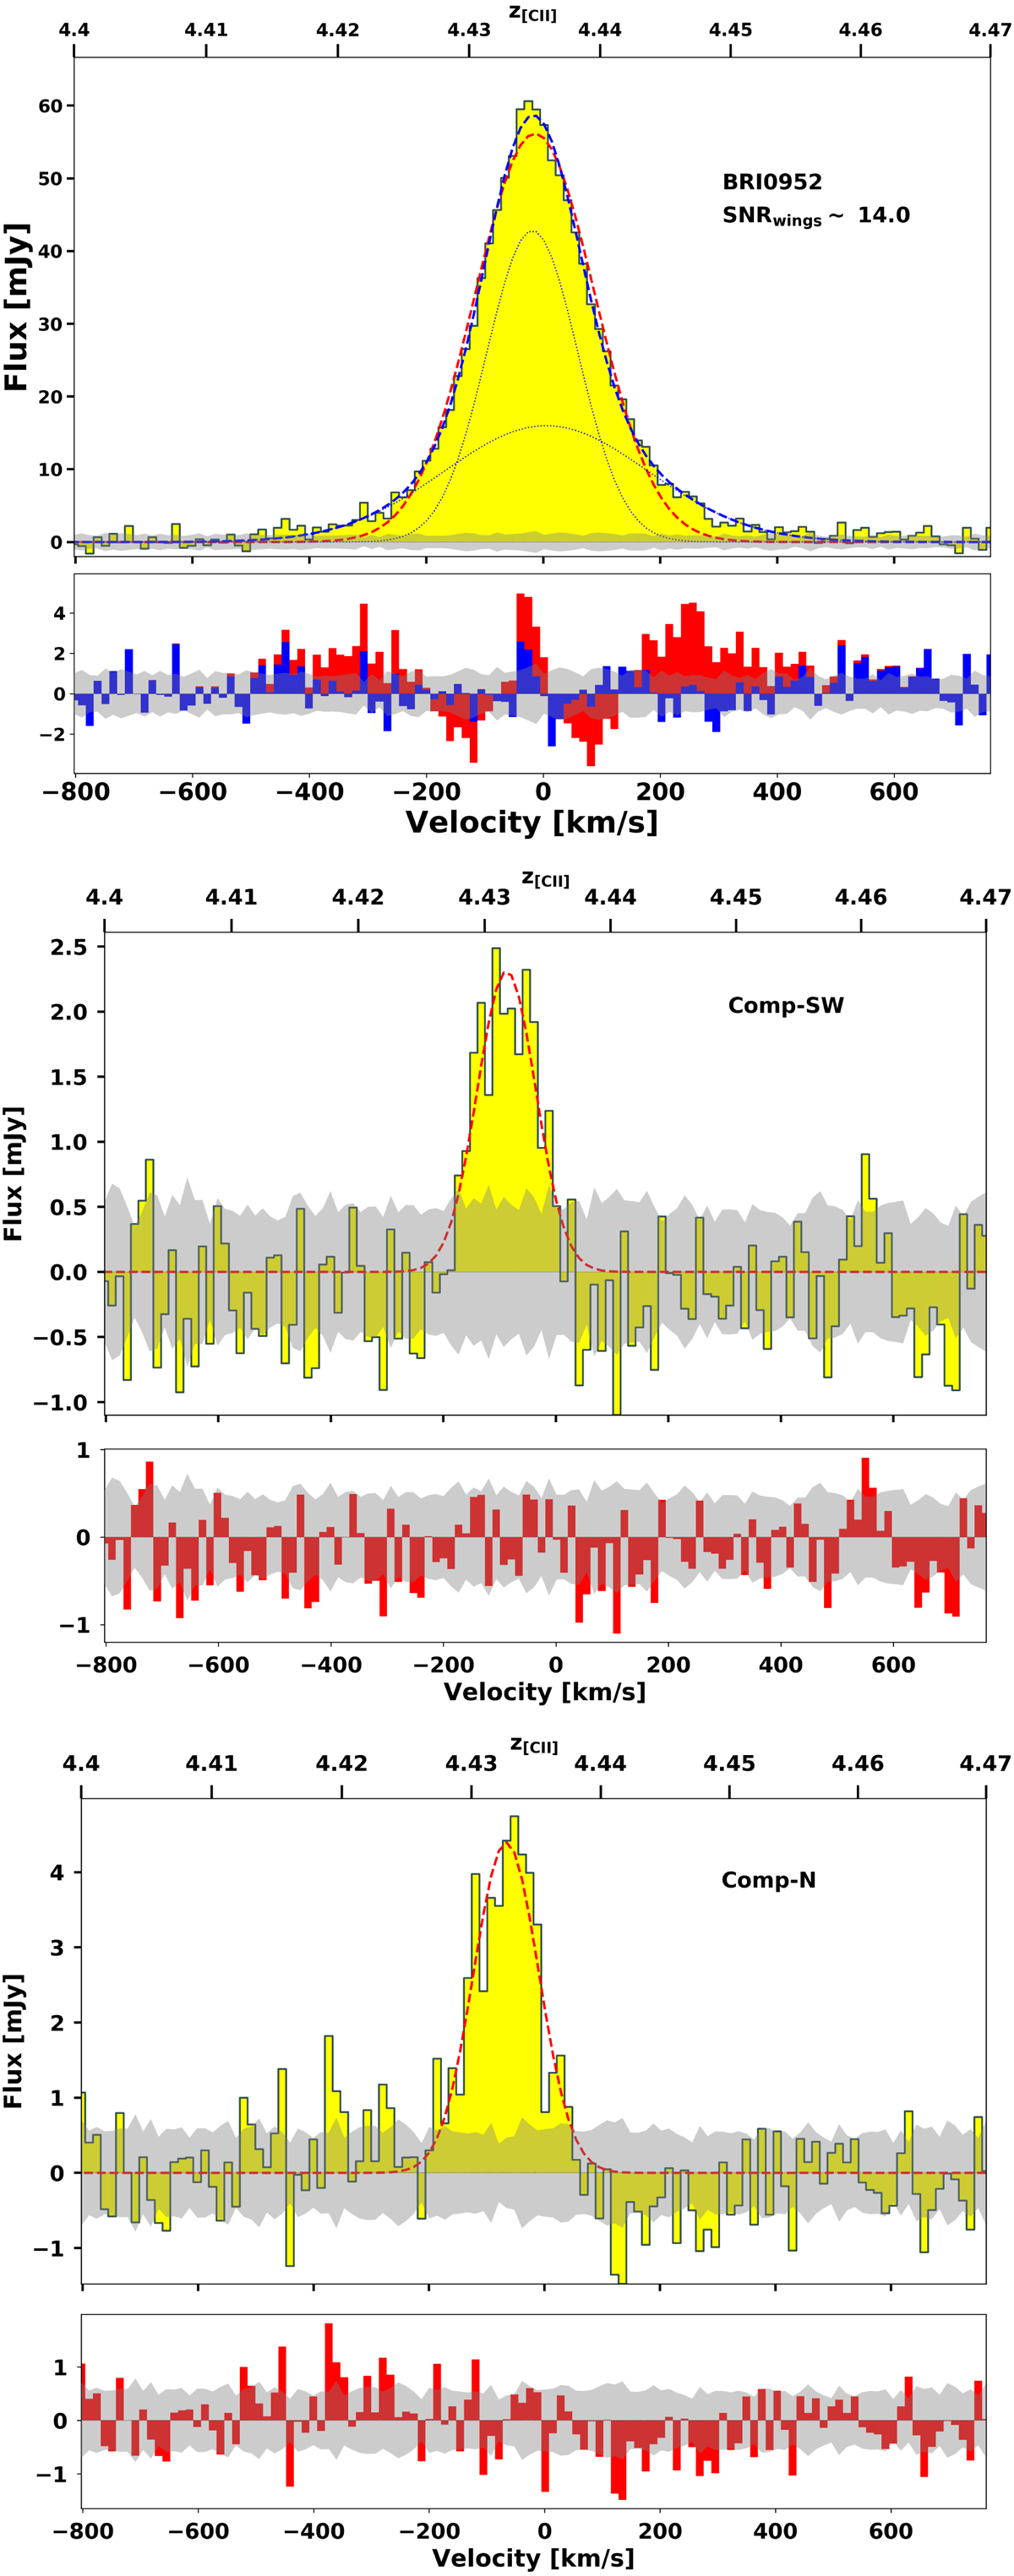
Fig. 3.
Download original image
Spectra of [C II] emission toward BRI0952 and companions. The two companions’ line profiles are fit with a single Gaussian, which is shown in red. The quasar’s line emission profile is fit with a single Gaussian (red) and a double Gaussian (blue); the double Gaussian corresponding to outflow signatures is clearly seen. The gray region represents the rms of the data in each channel using the procedure described in Sect. 3.2.2.
Current usage metrics show cumulative count of Article Views (full-text article views including HTML views, PDF and ePub downloads, according to the available data) and Abstracts Views on Vision4Press platform.
Data correspond to usage on the plateform after 2015. The current usage metrics is available 48-96 hours after online publication and is updated daily on week days.
Initial download of the metrics may take a while.