Fig. 5.
Download original image
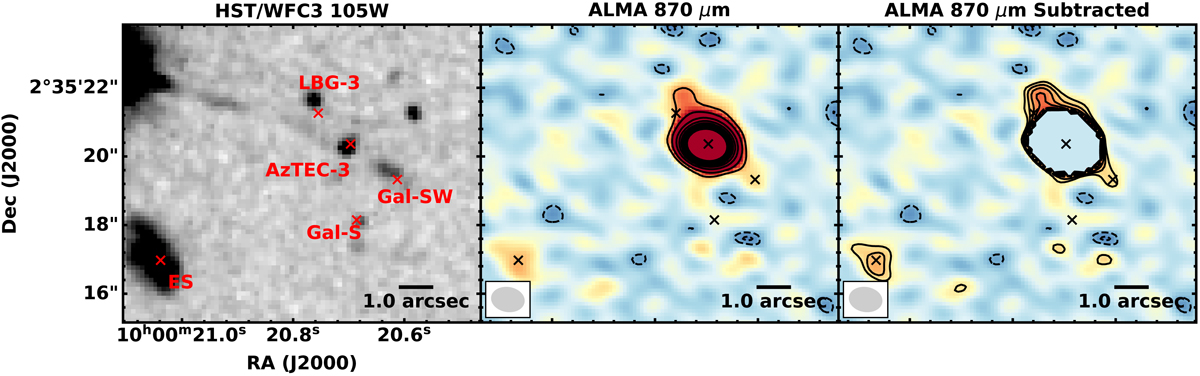
HST/WFC3 F105W (left) image of AzTEC-3 overlaid with source positions, ALMA 850 μm continuum map (center), and SMG subtracted map (right). The continuum maps were created using line-free channels. The residual map was produced following the steps described in Sect. 3.3.2. The original continuum image contours are shown at −3, −2, 5, 10, 20, 30, 40, 50, 60, 70, and 80σ levels. The subtracted image contours are shown at −3, −2, 3, 4, 5, 6, and 7σ levels. Synthesized beams are shown in the bottom left of the ALMA images.
Current usage metrics show cumulative count of Article Views (full-text article views including HTML views, PDF and ePub downloads, according to the available data) and Abstracts Views on Vision4Press platform.
Data correspond to usage on the plateform after 2015. The current usage metrics is available 48-96 hours after online publication and is updated daily on week days.
Initial download of the metrics may take a while.