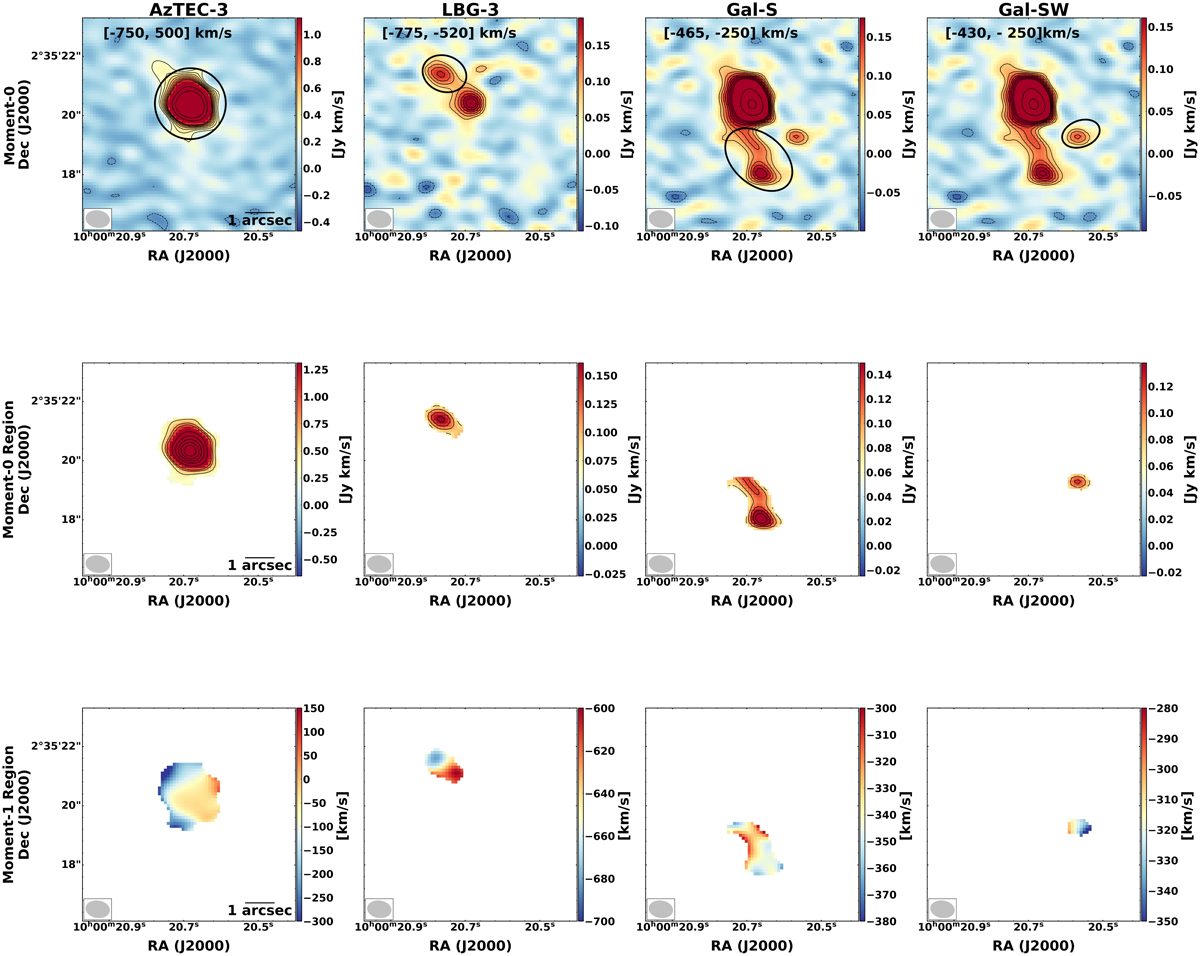
Fig. 7.
Download original image
Moment-0 and moment-1 maps for AzTEC-3 system. The top row shows moment-0 maps of the original [C II] and the central row shows the moment-0 map of the region from which the spectra were extracted and are centered at the respective redshifts of the sources. The bottom row shows the moment-1 maps from each using the same region that the spectra were extracted from. The contours in the first panel for AzTEC-3 are shown at −3, −2, 10, 20, 30, 40, 50, and 60σ levels, and the contours shown in subsequent panels are at −3, −2, 3, 4, 5, 6, and 7σ levels where the respective 1σ noise level has been taken from individual moment-0 maps due to the restrictive velocity ranges (and thus differing noise levels). The black circle and ellipses in the top row show the regions from which the spectra were extracted for each source. The synthesized beam is shown in the bottom left of the images.
Current usage metrics show cumulative count of Article Views (full-text article views including HTML views, PDF and ePub downloads, according to the available data) and Abstracts Views on Vision4Press platform.
Data correspond to usage on the plateform after 2015. The current usage metrics is available 48-96 hours after online publication and is updated daily on week days.
Initial download of the metrics may take a while.