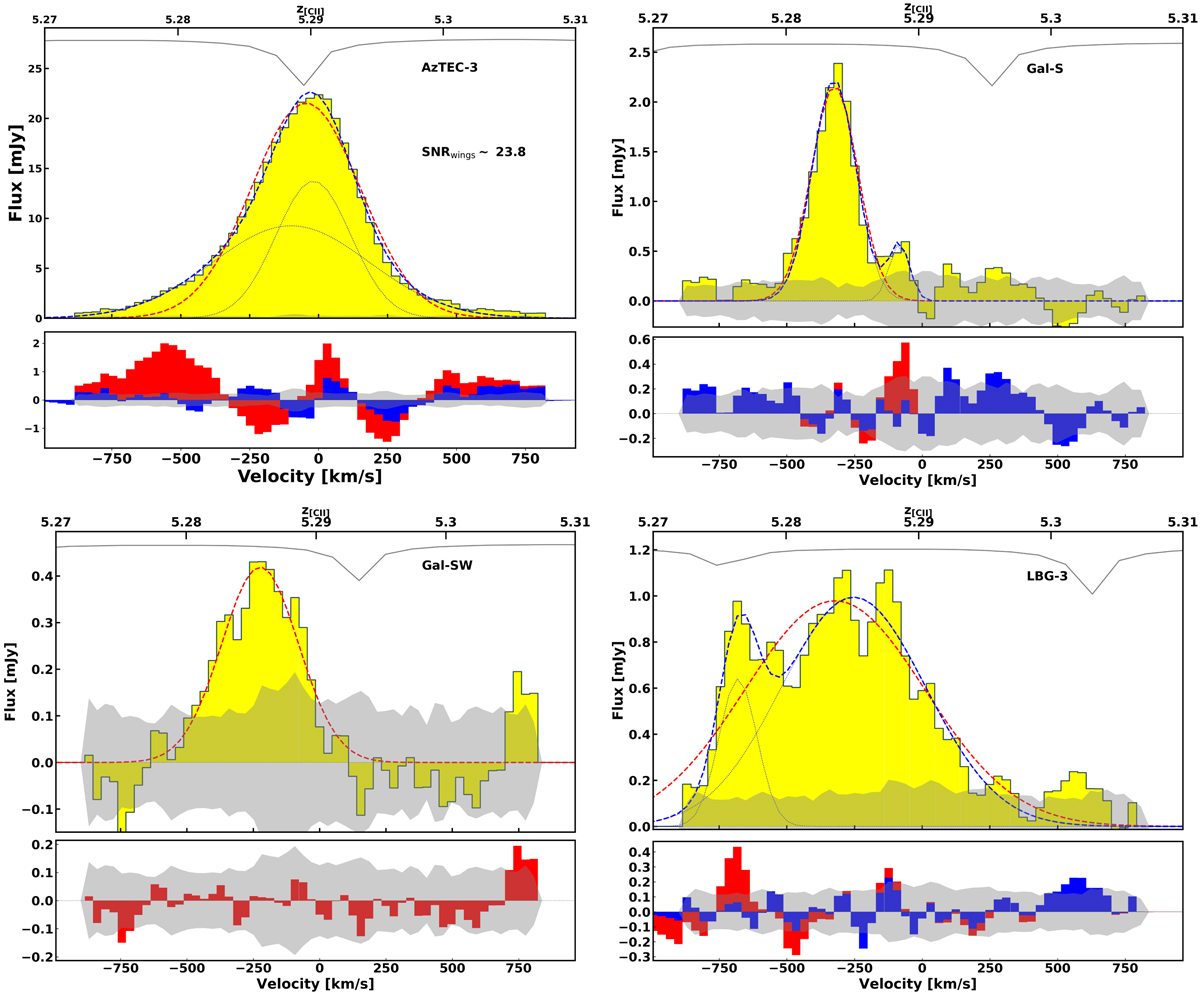
Fig. 8.
Download original image
Spectra for the AzTEC-3 system. The red line shows the single Gaussian fit to the data, and the blue line shows the double Gaussian fit to the data. For AzTEC-3, the blue wing < − 500 km s−1 is significantly more prominent than the red wing. We fit LBG-3 and Gal-SW with double Gaussians to account for the additional “bumps” in the spectra (most obvious in LBG-3), which are likely blended flux from the SMG. The atmospheric transmission is shown as a gray line in the top subplot for every source.
Current usage metrics show cumulative count of Article Views (full-text article views including HTML views, PDF and ePub downloads, according to the available data) and Abstracts Views on Vision4Press platform.
Data correspond to usage on the plateform after 2015. The current usage metrics is available 48-96 hours after online publication and is updated daily on week days.
Initial download of the metrics may take a while.