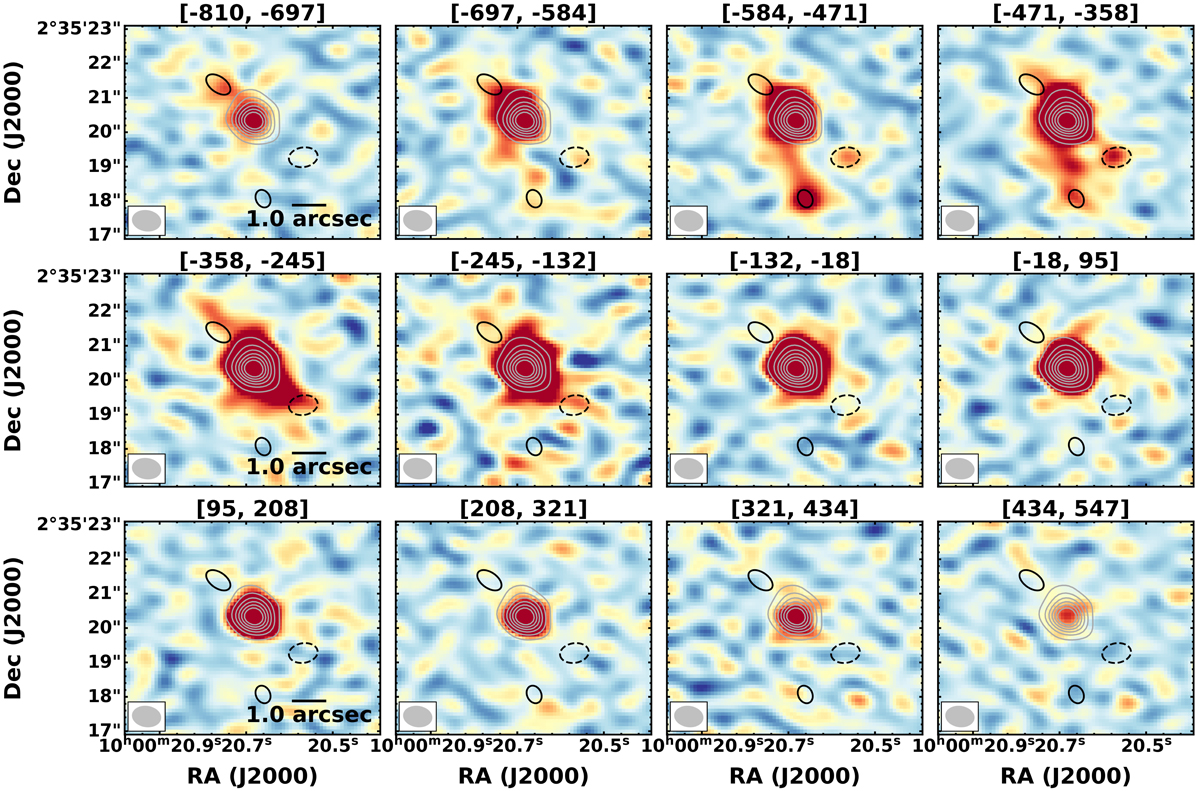
Fig. 9.
Download original image
Velocity maps of AzTEC-3 showing [C II] emission across the velocity range of the line. The velocity range is provided at the top of the images. The gray contours are at 10, 20, 30, 40, 50, and 60σ levels from the moment-0 map of AzTEC-3, which is shown in Fig. 7. The black ellipses indicate the positions and sizes of the three companions from CASA’s IMFIT routine where the dashed ellipse around Gal-SW denotes an upper-limit point source. The “gas-bridge” structure between AzTEC-3 and Gal-S is seen in the velocity range of −584 to −358 km s−1. The size of the synthesized beam is shown in the bottom left corner of the images.
Current usage metrics show cumulative count of Article Views (full-text article views including HTML views, PDF and ePub downloads, according to the available data) and Abstracts Views on Vision4Press platform.
Data correspond to usage on the plateform after 2015. The current usage metrics is available 48-96 hours after online publication and is updated daily on week days.
Initial download of the metrics may take a while.