Open Access
Fig. 11
Download original image
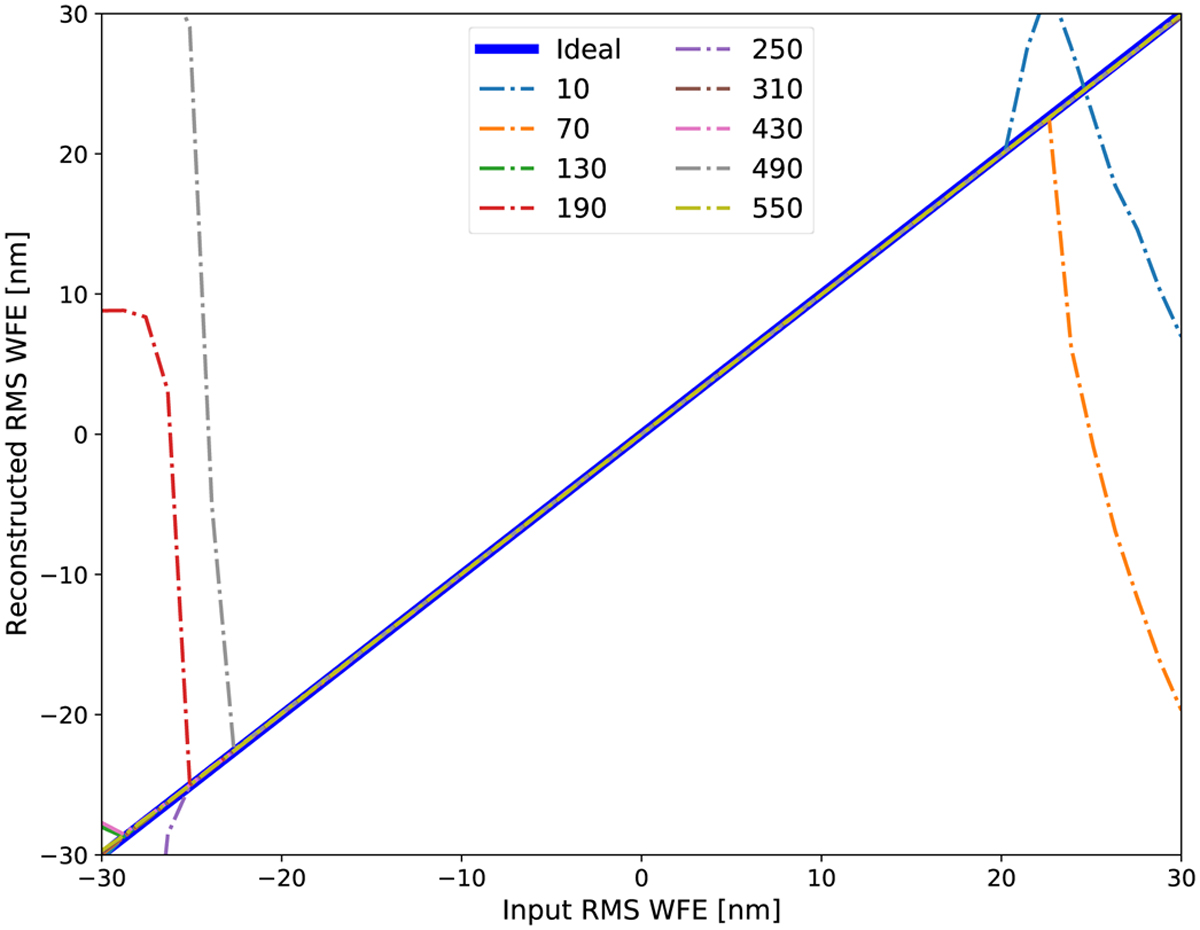
Measured linearity curves for 10 eigenmodes. The solid thick blue line represents an ideal linearity curve, and dash-dotted lines with different colors indicate the measured linearity curves of the 10 eigenmodes.
Current usage metrics show cumulative count of Article Views (full-text article views including HTML views, PDF and ePub downloads, according to the available data) and Abstracts Views on Vision4Press platform.
Data correspond to usage on the plateform after 2015. The current usage metrics is available 48-96 hours after online publication and is updated daily on week days.
Initial download of the metrics may take a while.