Fig. 8
Download original image
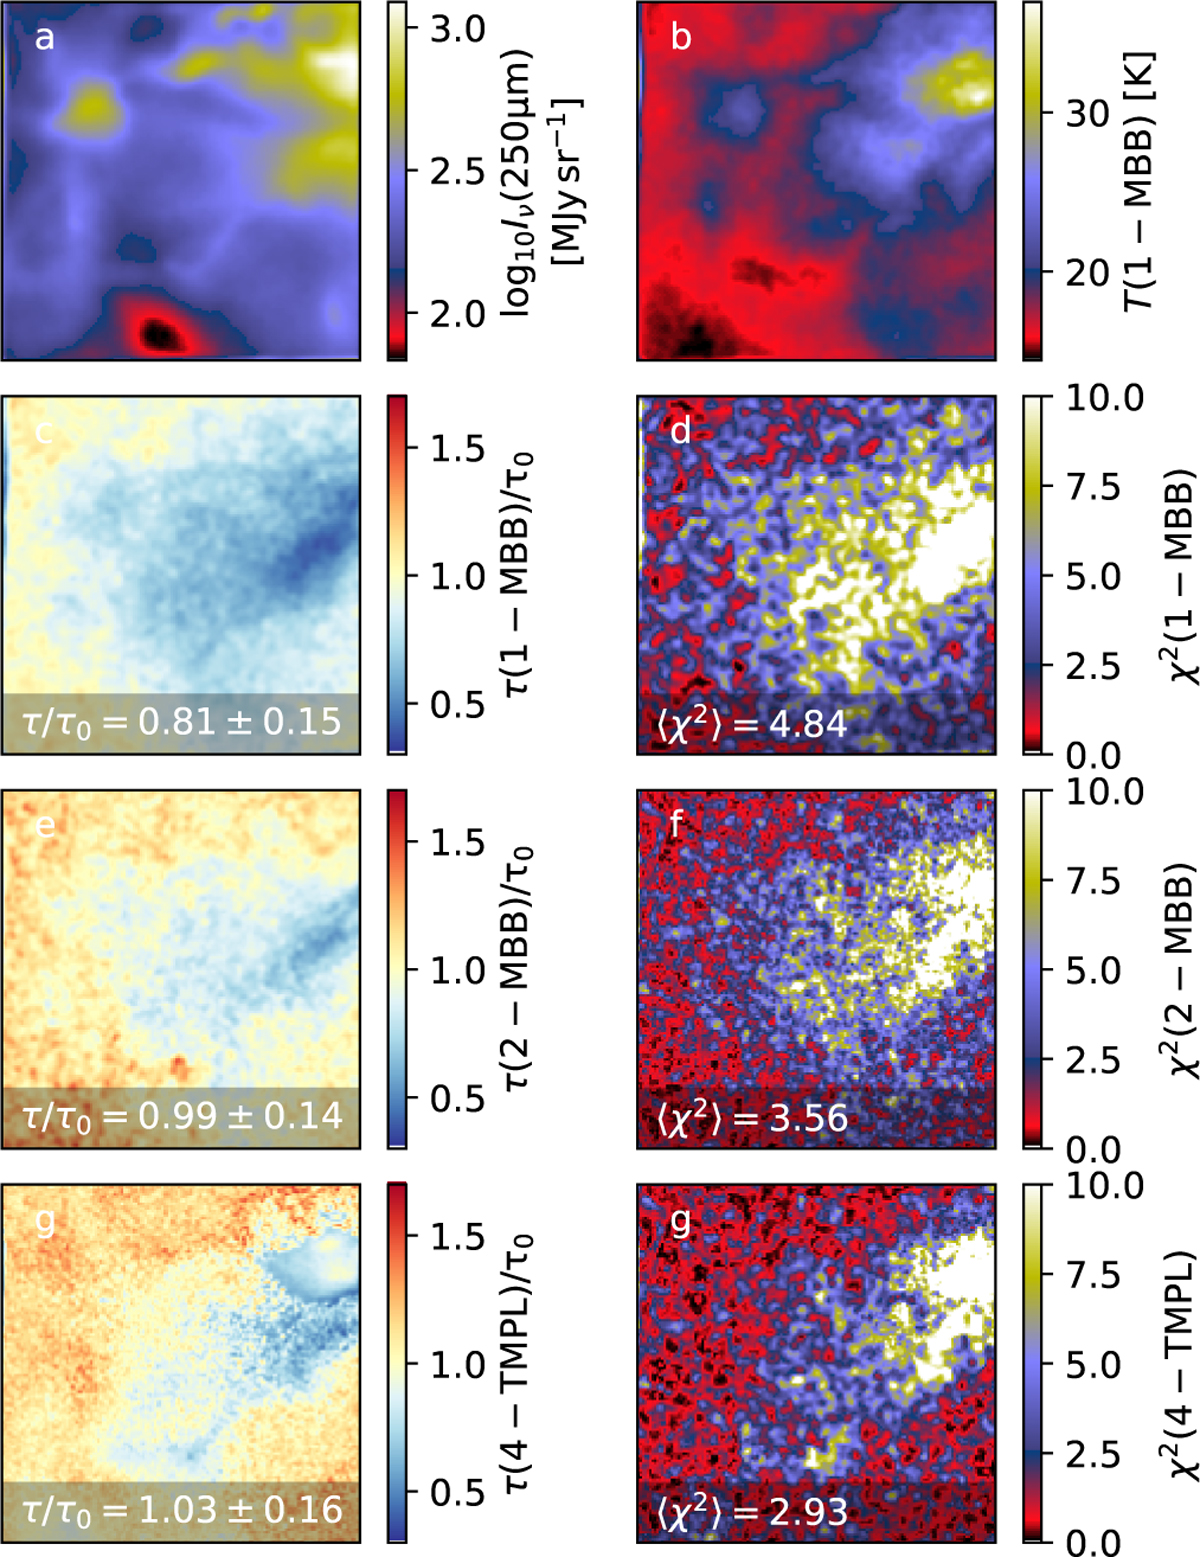
IRDC observations fitted with 1-MBB, 2-MBB, and 4-TMPL models. Frames a-b show the 250 μm intensities and colour temperatures from the 1-MBB fit. The second row shows the 1-MBB τ estimates relative to the correct values (frame c) and the χ2 values (frame d). The third and fourth rows show the corresponding data for the 2-MBB and 4-TMPL flts. The plots cover a 256 × 256 pixel area of the IRDC cloud model.
Current usage metrics show cumulative count of Article Views (full-text article views including HTML views, PDF and ePub downloads, according to the available data) and Abstracts Views on Vision4Press platform.
Data correspond to usage on the plateform after 2015. The current usage metrics is available 48-96 hours after online publication and is updated daily on week days.
Initial download of the metrics may take a while.