Fig. 11
Download original image
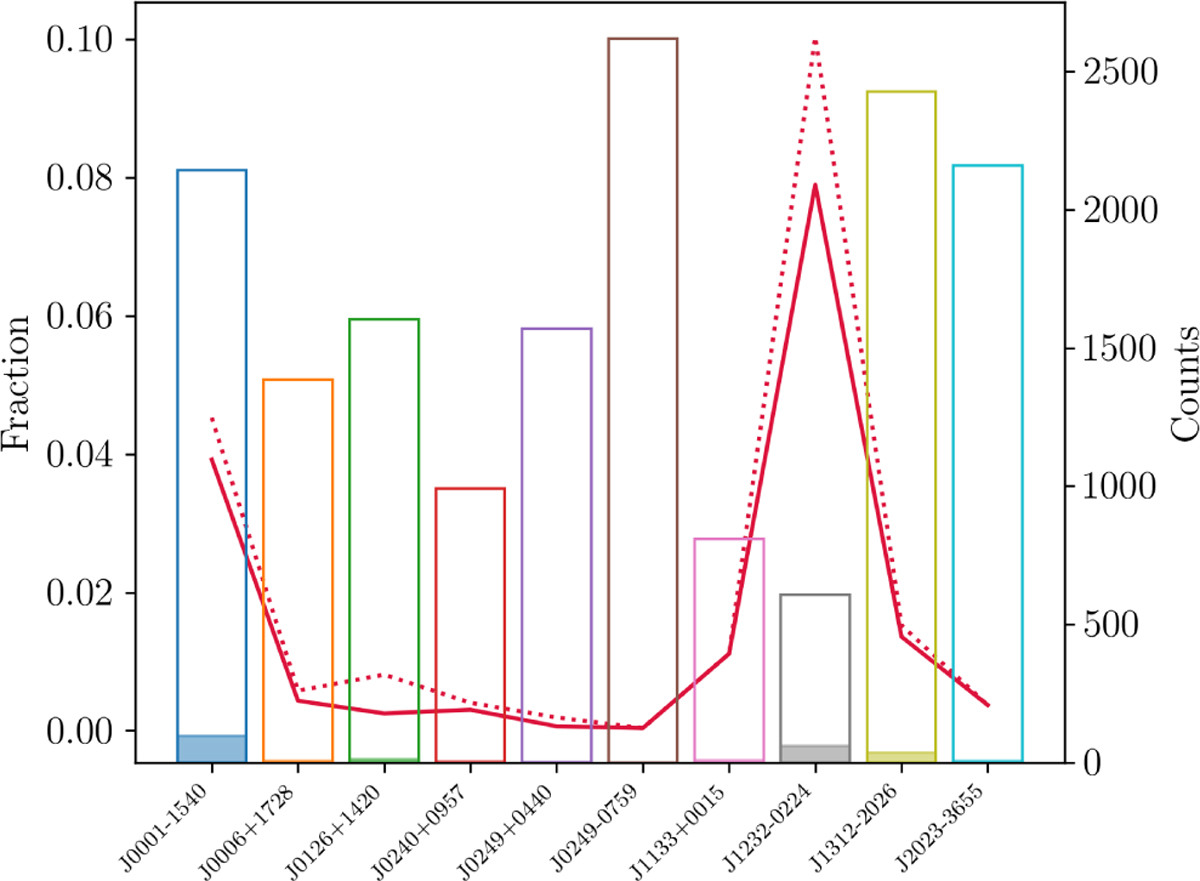
Purity of catalogues for different pointings. The fraction of false detections is indicated by the red line. The dashed red line indicates the fraction of false detections without flagging artefacts. The open histograms show the number of sources detected in the pointings, with the filled histograms indicating the number of false detections.
Current usage metrics show cumulative count of Article Views (full-text article views including HTML views, PDF and ePub downloads, according to the available data) and Abstracts Views on Vision4Press platform.
Data correspond to usage on the plateform after 2015. The current usage metrics is available 48-96 hours after online publication and is updated daily on week days.
Initial download of the metrics may take a while.