Fig. 16
Download original image
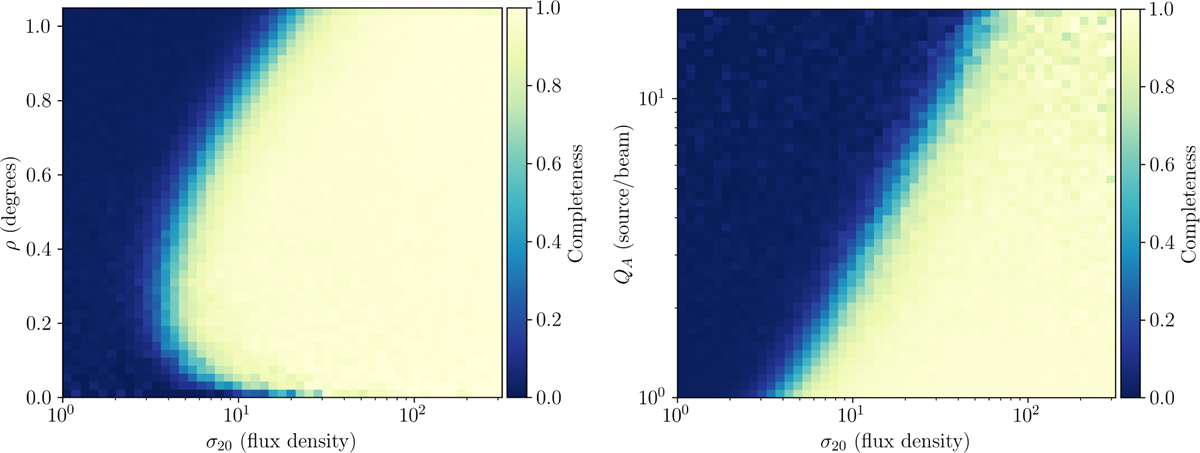
Combined source completeness as a function of distance from the pointing centre (unresolved sources, left) and major axis of the source (resolved sources, right). The left plot reflects the overall structure of the pointings, and shows that completeness is quite straightforwardly a radially averaged version of the noise structure as shown in Fig. 3. Note that the flux density is normalised by σ20. The right plot indicates a clear power law relation between the size of sources and the completeness, where larger sources are on average less complete.
Current usage metrics show cumulative count of Article Views (full-text article views including HTML views, PDF and ePub downloads, according to the available data) and Abstracts Views on Vision4Press platform.
Data correspond to usage on the plateform after 2015. The current usage metrics is available 48-96 hours after online publication and is updated daily on week days.
Initial download of the metrics may take a while.