Open Access
Fig. 17
Download original image
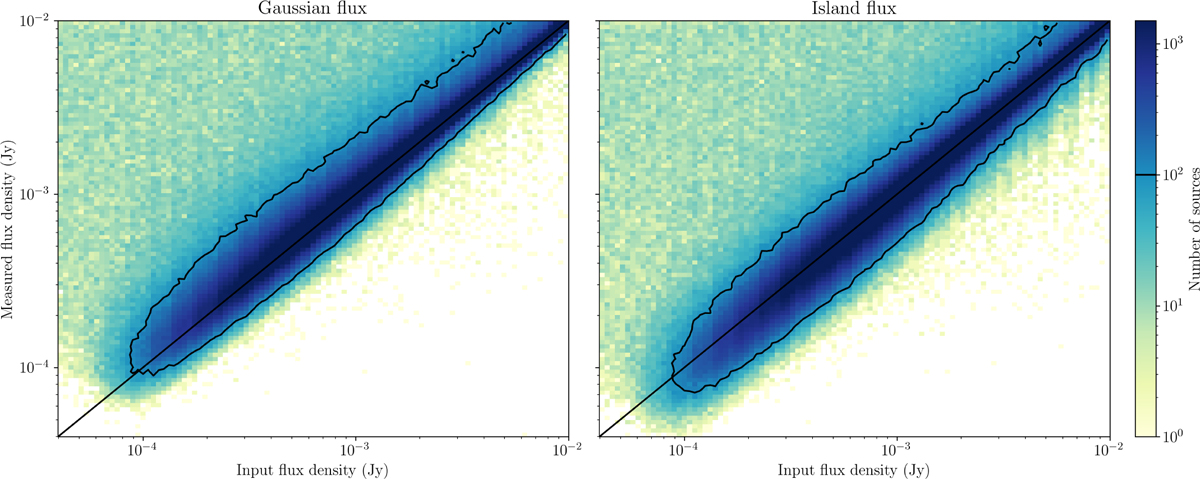
Input flux density plotted against the measured flux density for both Gaussian flux densities (left) and Island flux densities (right). The threshold of 100 sources per bin (black contour) shows quite clearly the bias present in Gaussian flux densities compared to island flux densities.
Current usage metrics show cumulative count of Article Views (full-text article views including HTML views, PDF and ePub downloads, according to the available data) and Abstracts Views on Vision4Press platform.
Data correspond to usage on the plateform after 2015. The current usage metrics is available 48-96 hours after online publication and is updated daily on week days.
Initial download of the metrics may take a while.